Cities release 70% of CO2 emissions and utilize two-thirds of global energy production, while buildings consume more than one-third of global final energy consumption; thus, growing energy-usage efficiency in buildings provides more opportunities for sustainable development. As a result of its rapid urbanization, such opportunities are especially important for China. This article reviews a paper in the journal Buildings.
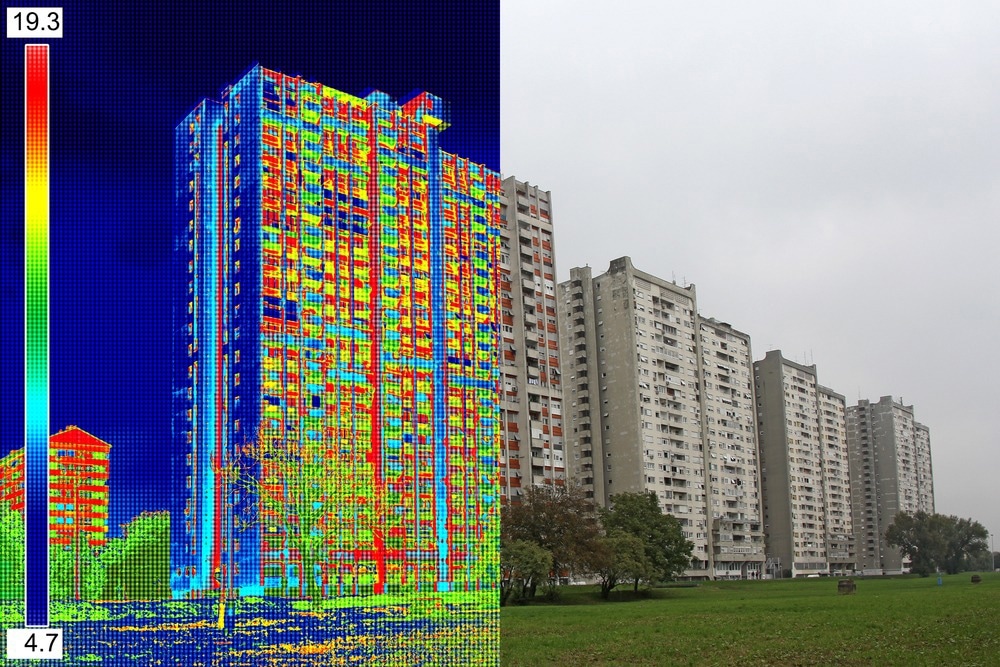
Study: Modelling Building Stock Energy Consumption at the Urban Level from an Empirical Study. Image Credit: Ivan Smuk/Shutterstock.com
According to Statista’s global data platform, China’s population urbanization rate will be 64.72% by the end of 2021. This implies that there will be greater demand for energy in buildings, which will result in higher carbon emissions.
As a result, it is critical to have a thorough understanding of the dynamic energy consumption of buildings in particular cities with dense urban environments. Figure 1 depicts the amount of floor space under construction and to be completed between 2015 and 2019, with a clear yearly increase.
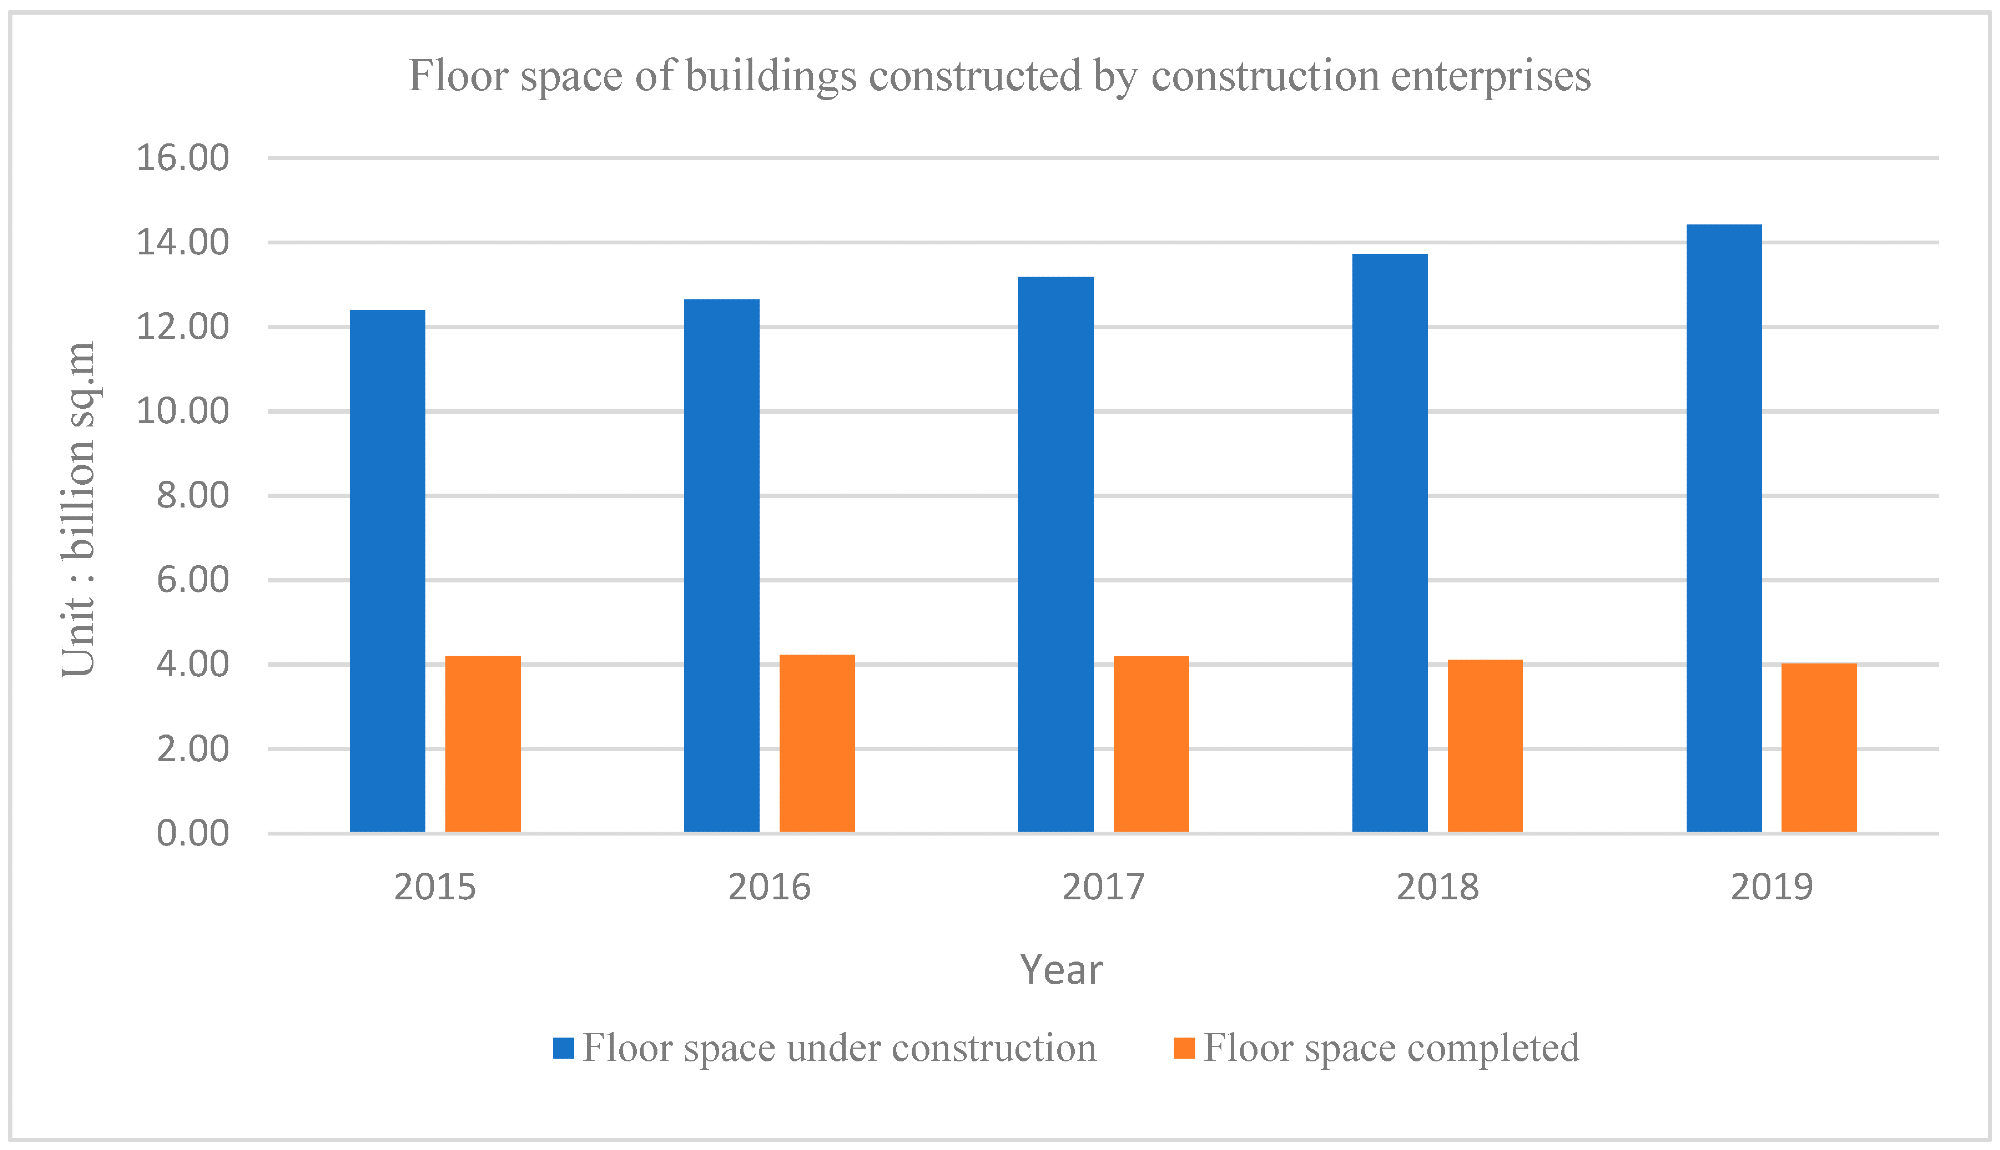
Figure 1. Floor space of buildings constructed by construction enterprises. Image Credit: Ji, et al., 2022
Quantifying urban-scale energy use in buildings is an intricate, cross-sectoral, and multi-scale challenge that is heavily reliant on the urban environment.
Most urban building energy modeling, moreover, has largely ignored the effects of the urban environment around buildings. Some, for instance, have completely ignored shading and the exchange of long-wave radiation between the environment and buildings.
A new paper reviews perspectives on urban building energy models before presenting a simple method for predicting building energy consumption from the various functions of building stock, using an archetypal physical-based, bottom-up approach as an example.
The urban building energy framework in this research perceives the effects of the urban environment on the simulation, which can fill the knowledge gaps in the previous study. Furthermore, this research describes all of the processes that can be replicated with minimal difficulty to further research references.
Figure 2 depicts the outline of the approaches for urban building energy modeling.
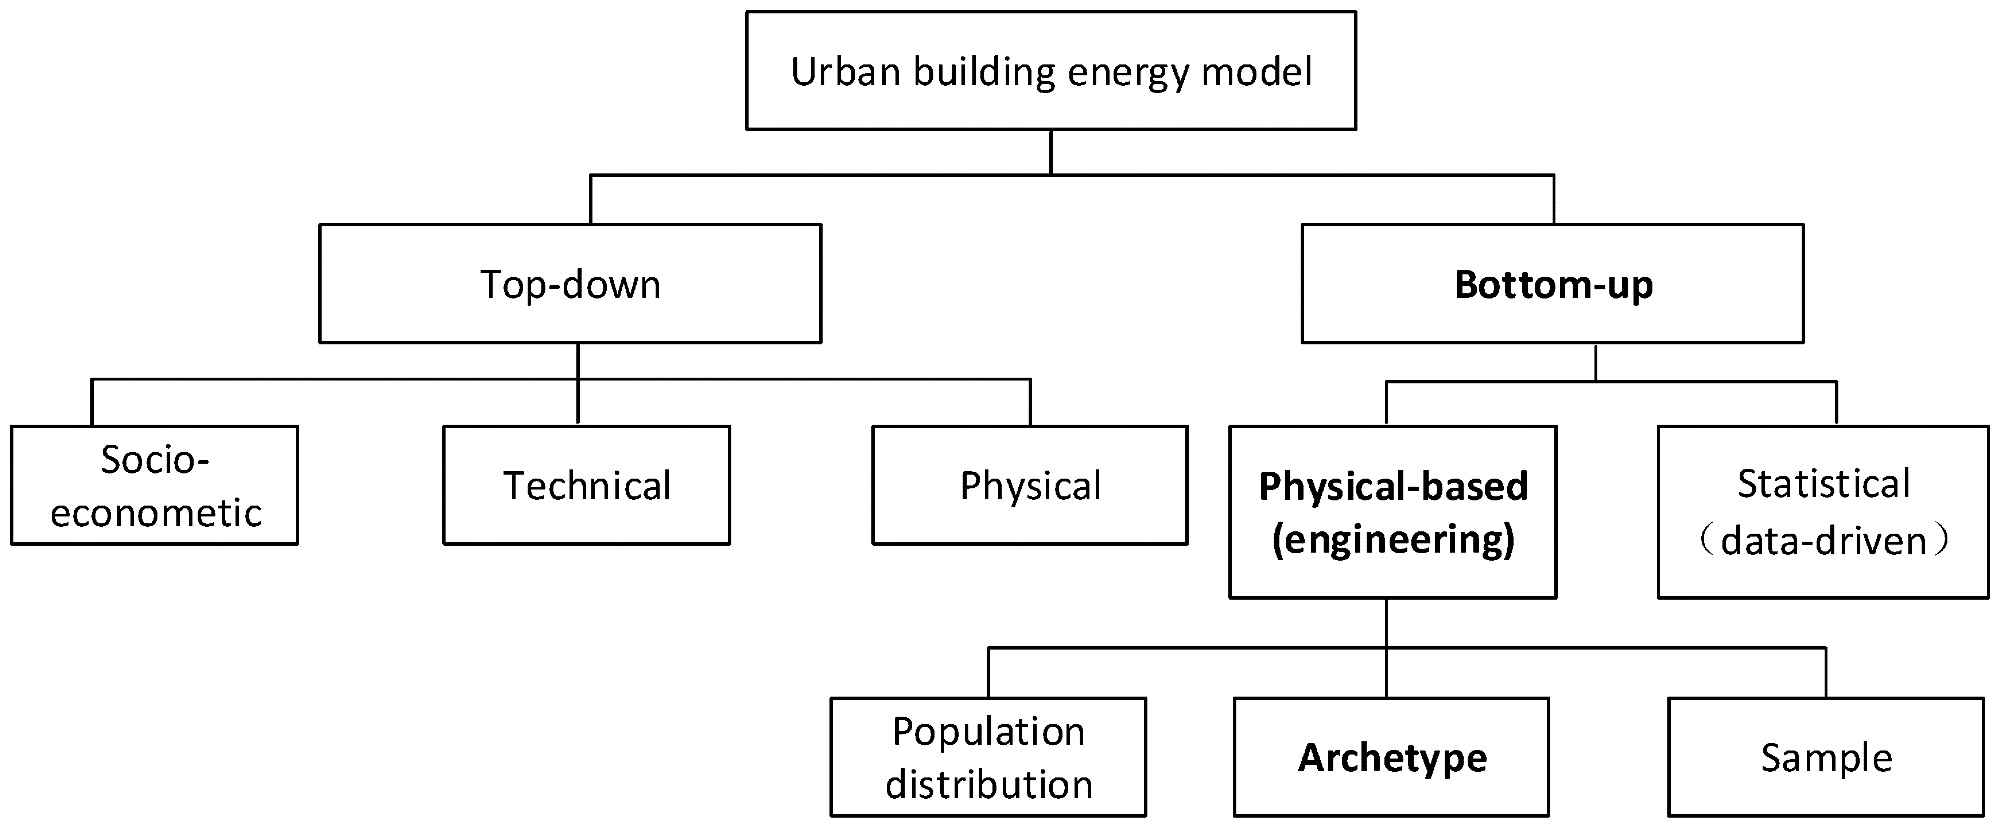
Figure 2. Approaches to modeling urban building energy. Image Credit: Ji, et al., 2022
The top-down model forecast of urban building consumption is based on previous aggregate energy data; it also anticipates the long-term interrelations between energy use within an urban area and various types of variables, such as the economic system, cumulative climate conditions, and technological specifications, such as system or envelopes.
Bottom-up models forecast energy consumption within individual buildings before scaling up to neighborhoods or entire cities. Such models are reliable in deciding the most cost-effective ways to reduce carbon dioxide emissions using available technologies. The benefits and drawbacks of top-down and bottom-up approaches are summarized in Table 1.
Table 1. Comparison of urban building energy modeling approaches. Source: Kavjic, et al., 2010; Swan, et al., 2009; Lim, et al., 2017
| Urban Building Energy Modelling Approaches |
Top-Down |
Bottom-Up |
| Physical-Based |
Statistical-Based |
| Advantages |
Can make a continuous long-term prediction. |
Modelling with physically measurable data. |
Modelling can take into account macroeconomic and socioeconomic impacts. |
| Connections can be obtained between macroeconomics, social economics, and building energy consumption. |
Energy consumption calculation, based on the heat balance equation of the building. |
Include occupants’ behaviour. |
| Can predict building energy consumption under different energy policies and scenarios. |
Total energy demand can be predicted as well as the different end-users can be given (e.g., heating, cooling, and lighting). |
Simple to model and use. |
| The input data is simple and does not require building construction details. |
Can assess and quantify the impact of different technology combinations on energy consumption. |
Can predict the proportion of energy consumption for typical different end uses. |
| Disadvantages |
Highly depending on the data of historical energy consumption. |
Occupant behaviour and many uncertainty factors relating to energy consumption should be assumed. |
Data are limited to diversity and flexibility. |
| Predict energy consumption, based on the past economic conditions. |
A large amount of data should be investigated relating to buildings, and high computational volume. |
Limited capacity to assess the impact of energy efficiency measures. |
| Can not provide energy consumption of individual buildings, as well as the energy consumption of each component. |
Ignore the impact of economic factors on energy consumption. |
An extensive survey sample is required to represent the overall diversity. |
Due to individual end-uses, top-down models cannot differentiate energy consumption, as shown in the table above. Macroeconomic indicators, such as the economic system, price indices, and climatic factors, are frequently used variables. Correspondingly, the reliance on past data is a disadvantage, because top-down models cannot model irregular technological advances.
Bottom-up models can ascertain how much energy each end-use consumes and identify areas for improvement. This method can calculate total energy consumption without relying on historical data. The main disadvantage of this approach is that it requires more input data than top-down models, and bottom-up models are more difficult in terms of calculation or simulation methods.
Methodology
Figure 3 depicts the study’s process flow, which can be divided into three major steps. In the first step, data was collected, refined, and entered. In this step, buildings are also classified depending on their similar functions. The second step involved modeling urban building energy using the VirVil SketchUp plug-in and calculating HTB2. In the third step, energy demand was calculated using the monthly calculation, and the findings were compared to the standard level.
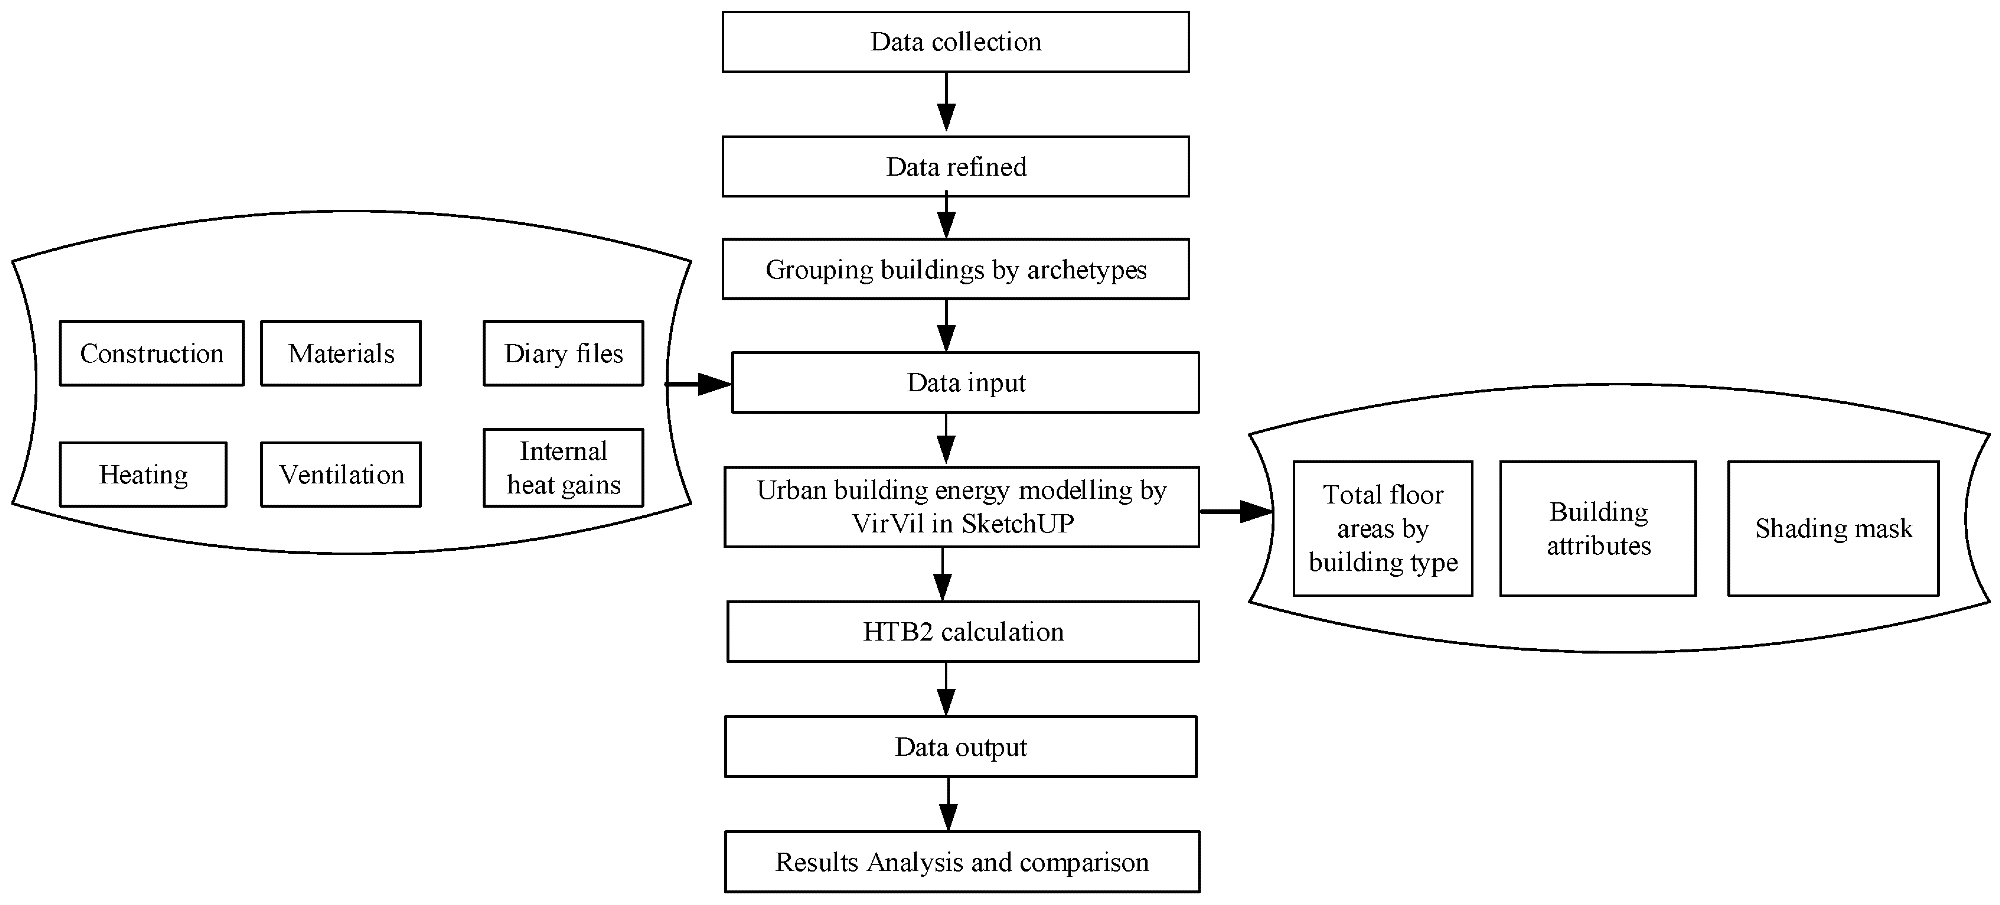
Figure 3. Research flow of this study. Image Credit: Ji, et al., 2022
Data from an on-site poll, publications, regional and national regulations, and websites were used in this study, which was conducted between 2015 and 2016. Table 2 depicts the methods for gathering this information. Building information (functions and floor areas), thermal properties (U values), as shown in Table 3, fabric construction methods (materials, construction, and glazing type), internal gains, and logbook files are all collected through on-site surveys.
Table 2. Approaches to data collection. Source: Ji, et al., 2022
| Building Classification |
Physical Buildings |
Land Use |
Diary File |
Energy Supply |
| On-site survey |
Website;
local regulations |
Local authority;
website;
on-site survey |
Investigation;
national standards |
On-site survey |
| Residential, commercial, office and education, hotel, and transport |
Location and climate zone;
Characteristics and properties of buildings (construction, materials, etc.) |
Proportions and built areas for each building type |
Occupancy and operating schedule |
Energy supply (electricity, gas, coal, renewables) |
Table 3. Thermal insulation levels for residential and public buildings in this research. Source: Ji, et al., 2022
| |
U Values |
U Values (w/m2/°C) |
| Elements |
|
Residential Buildings |
Public Buildings |
| Wall |
1.42 |
0.85 |
| Ceiling |
3.46 |
3.35 |
| Ground |
1.42 |
1.40 |
| Roof |
1.04 |
1.02 |
| Window |
5.4 |
5.32 |
Wuhan is located in the hot summer and cold winter zones, and it has a harsh climate during the summer and winter seasons. In July and August, it is incredibly hot, and it is freezing during the cold winter month of January.
Throughout the year, temperatures in the city average around 18 °C. The coldest month is January, with an average temperature of -10 °C. Without the impact of direct solar radiation, temperatures in July and August can reach nearly 40 °C, as shown in Figure 4.
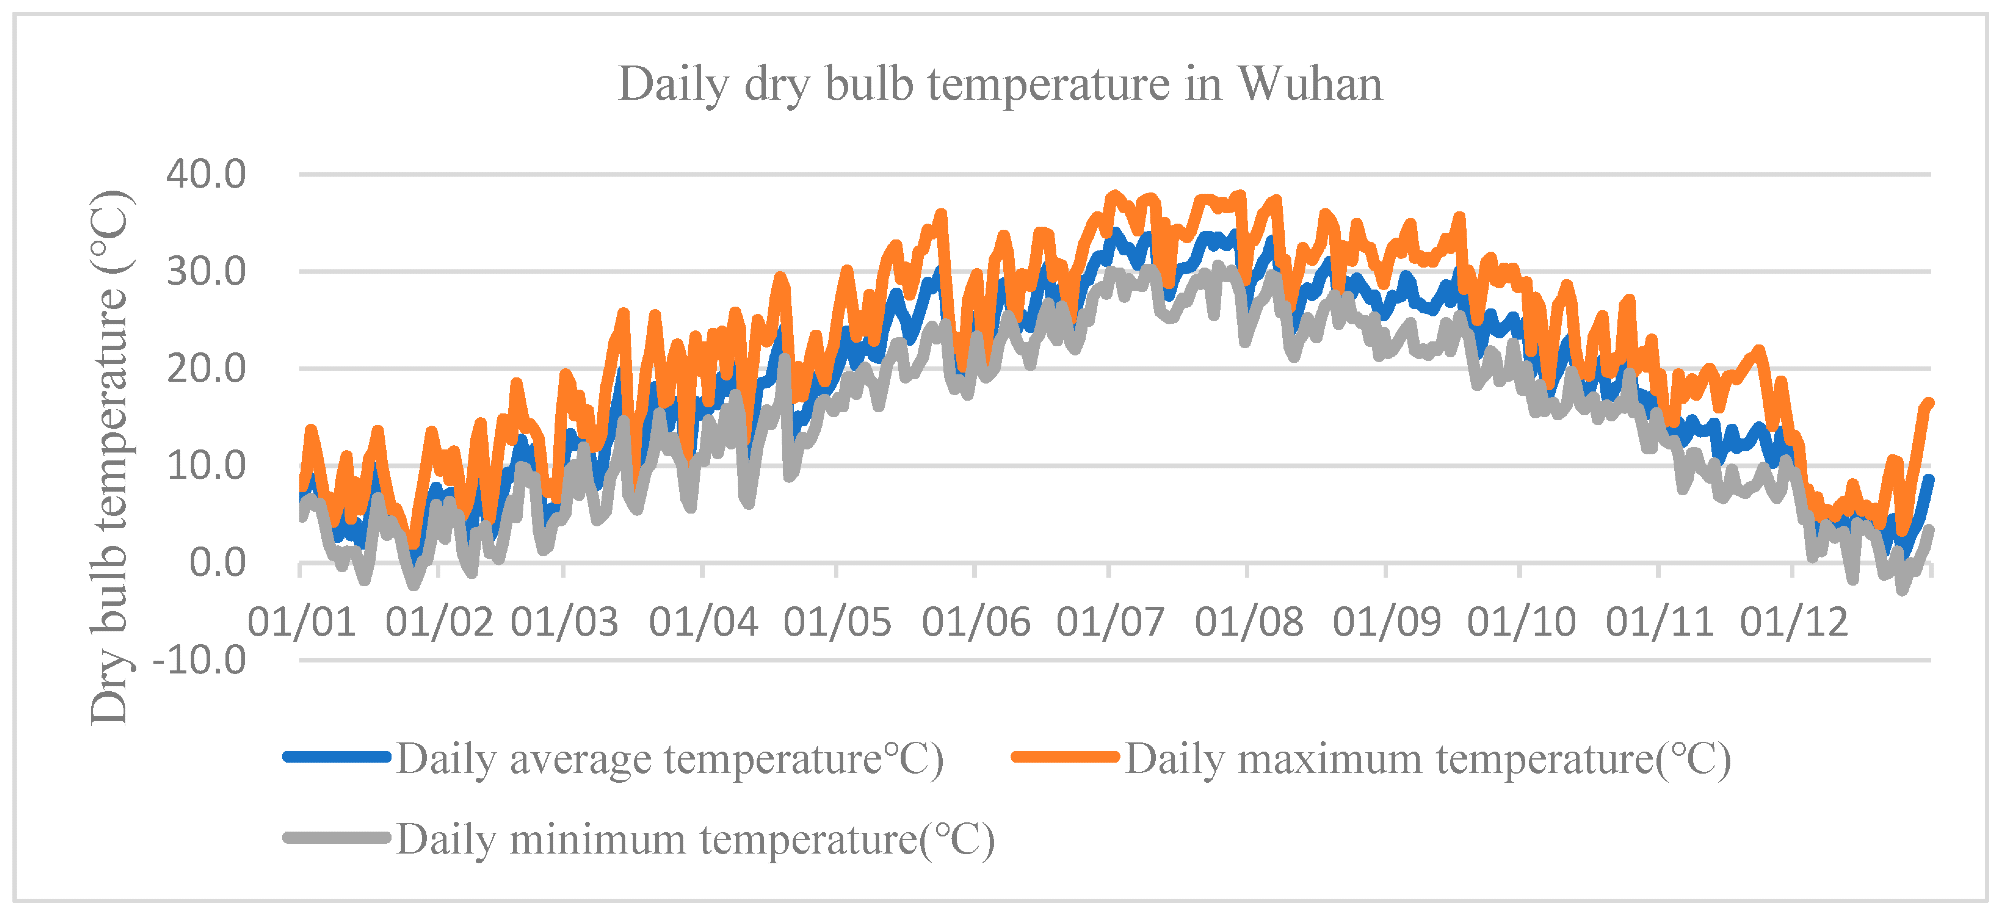
Figure 4. The statistics of daily dry bulb temperature in Wuhan. Image Credit: Ji, Q. 2018
Solar radiation reaches a maximum in July, with 650 MJ/m2, as shown in Figure 5, for total monthly solar radiation.
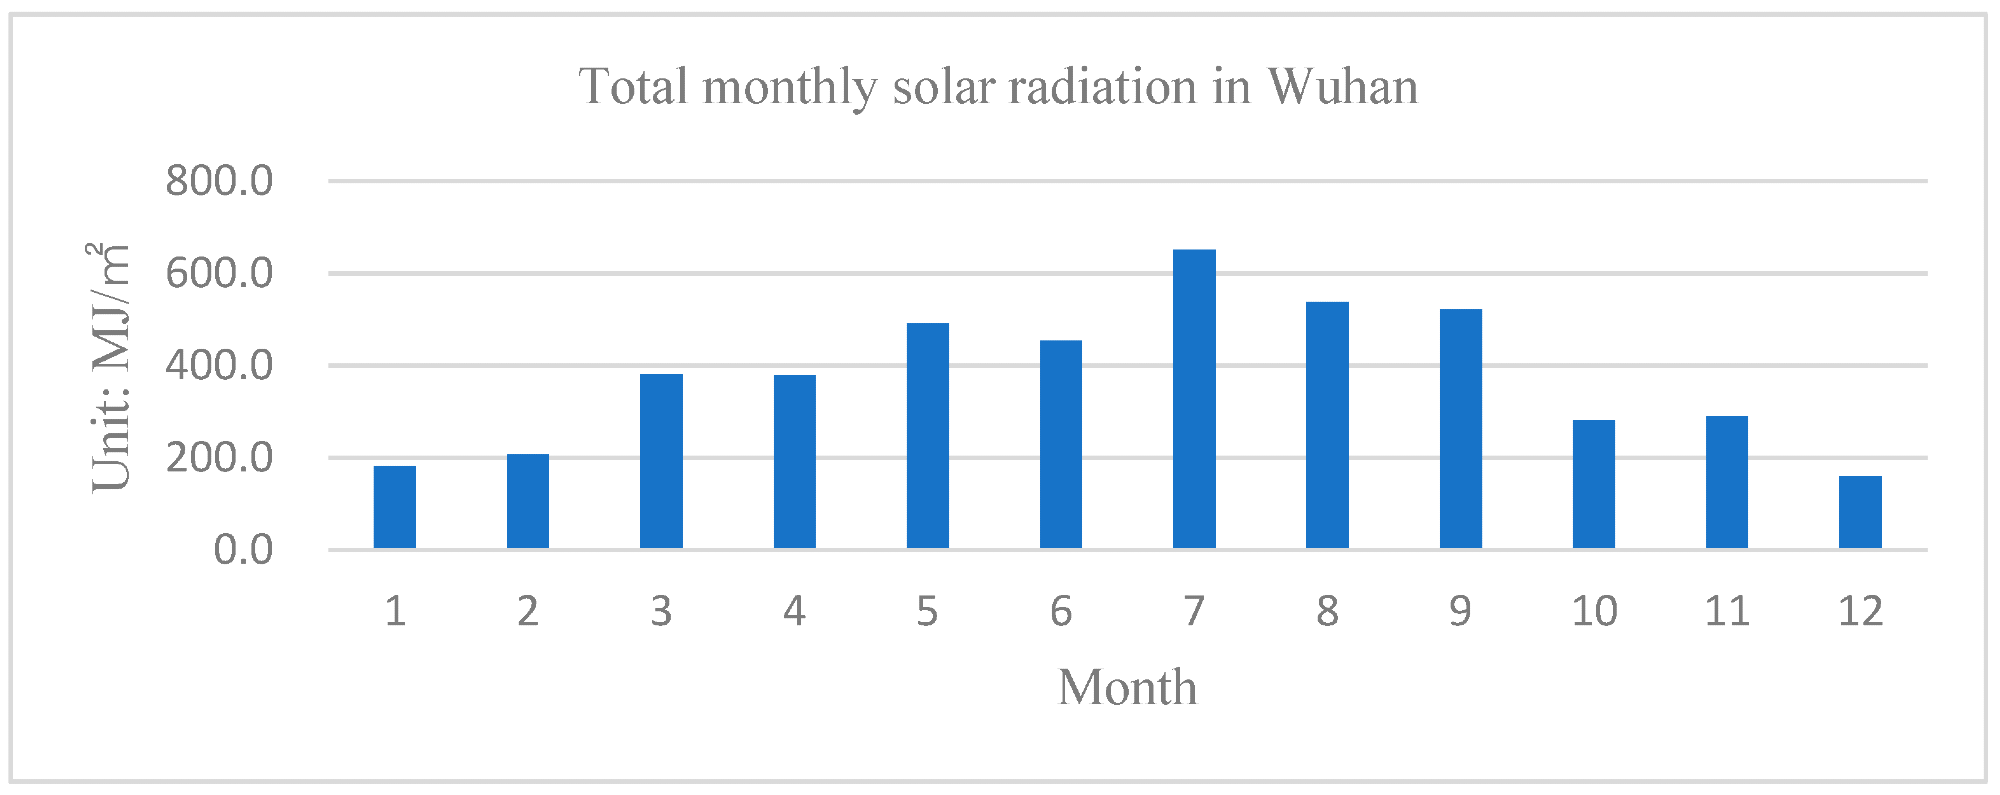
Figure 5. Total monthly solar radiation in Wuhan. Image Credit: Ji, Q. 2018
As shown in Figure 6, the urban building energy modeling consists of 10 typical block zones near Wuchang railway station, each with a radius of 1 km and an estimated area of 1.92 km2.
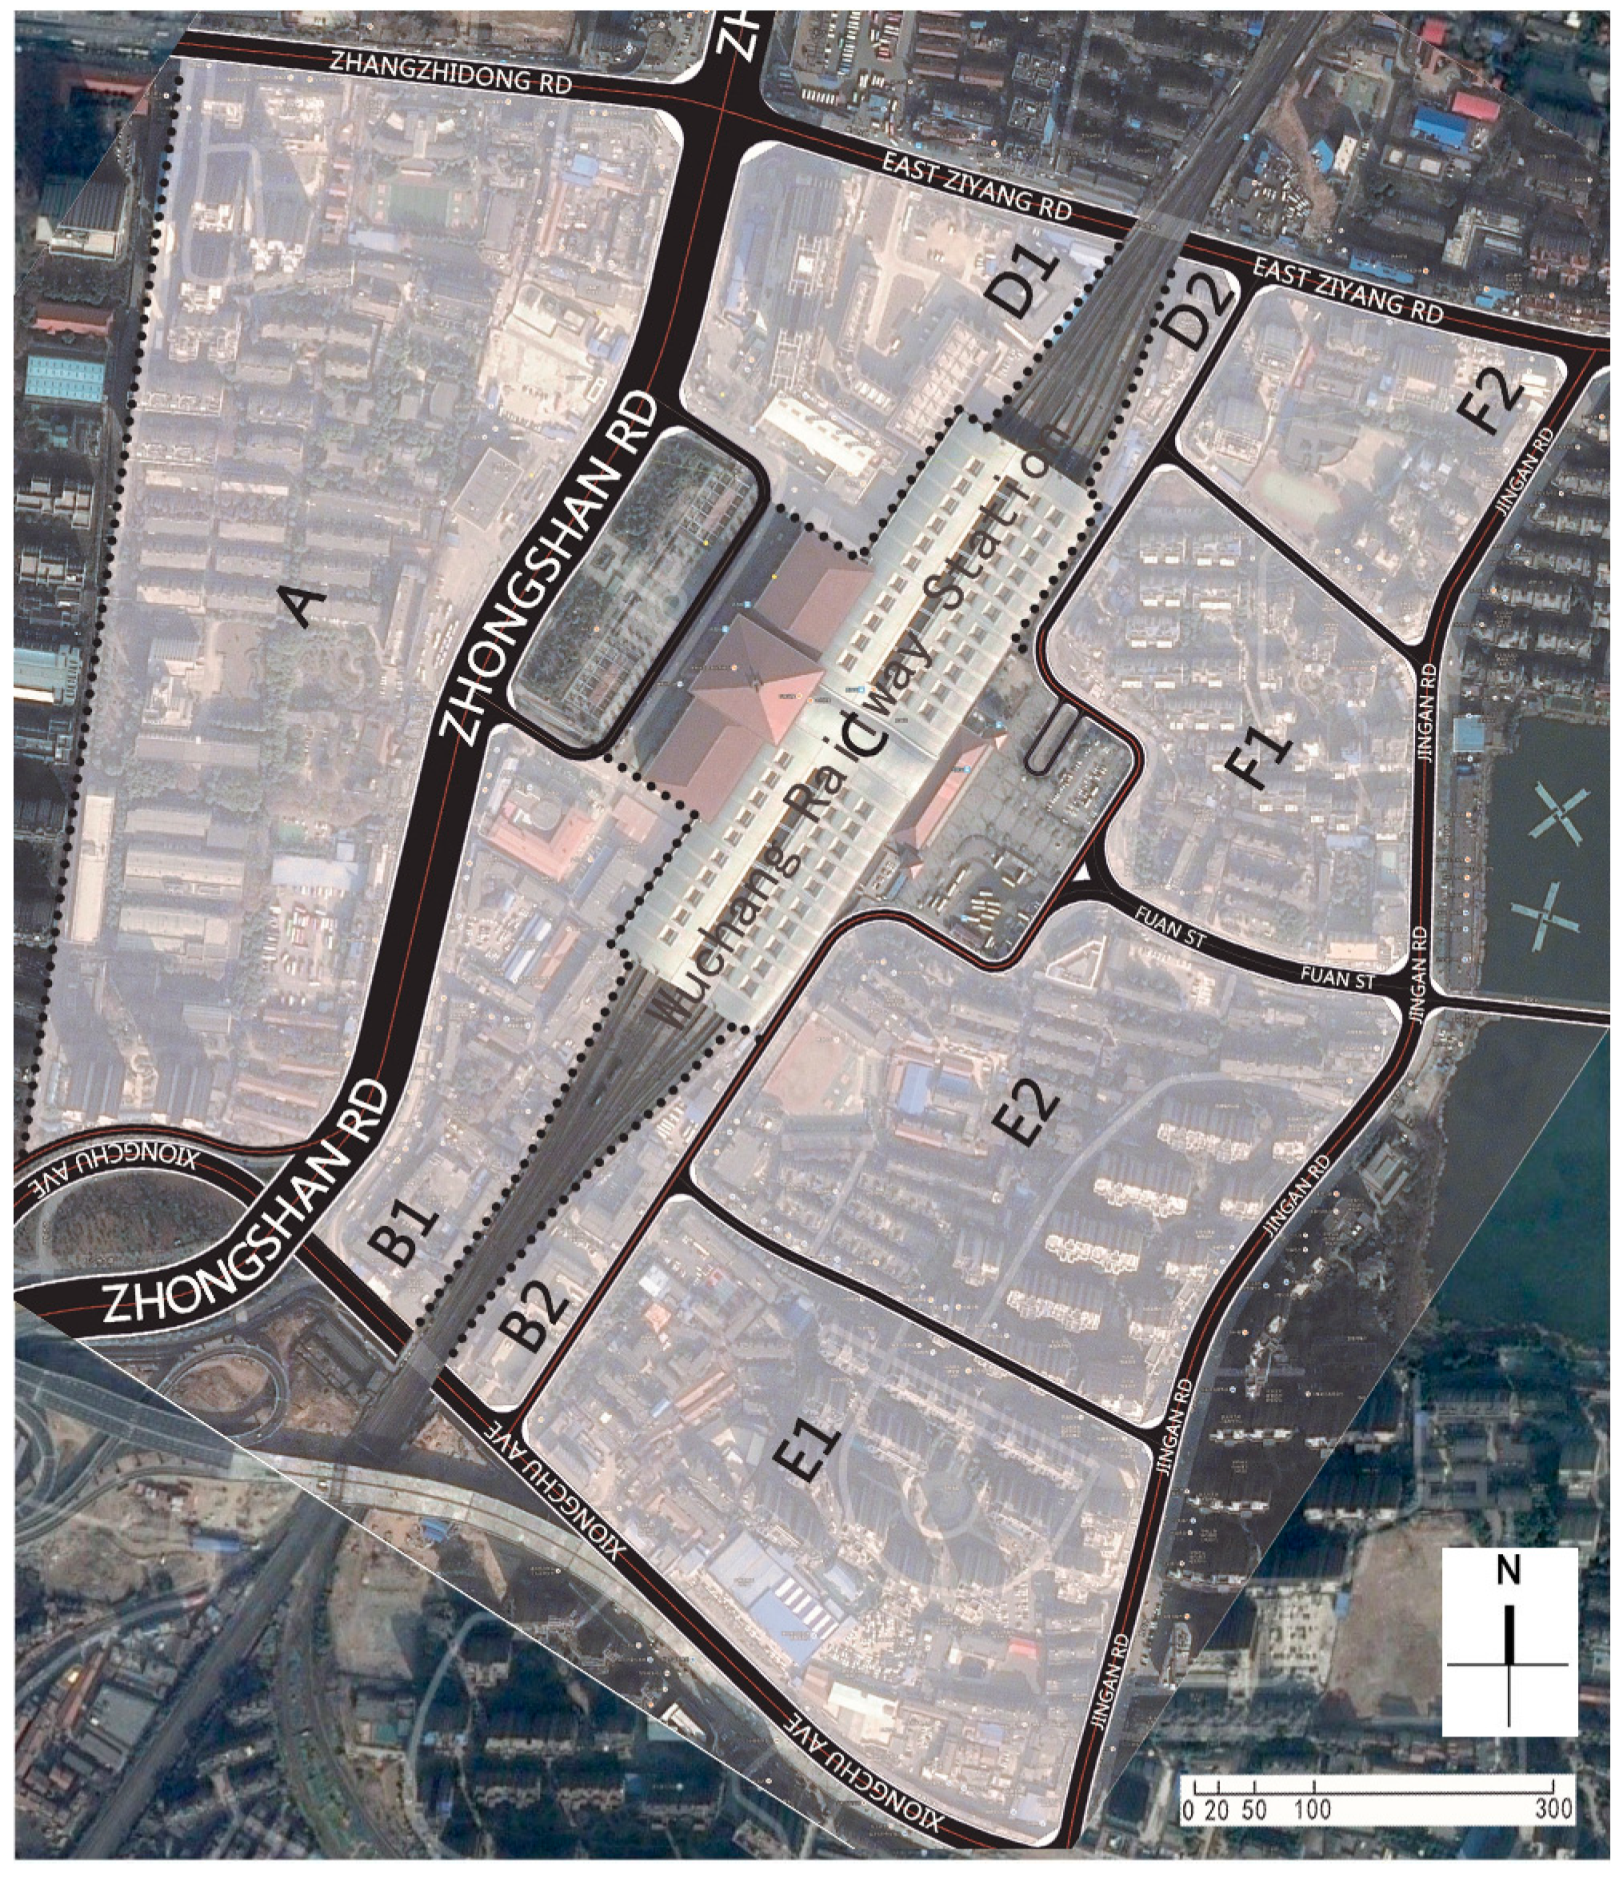
Figure 6. Ten-block zone for this study. Image Credit: Ji, et al., 2022
As shown in Figure 7, 64% of the buildings are residential, 13% are academic, and 12% are commercial. Besides the railway station’s west square, the basic building category in the station’s eastern part is a residential dwelling.
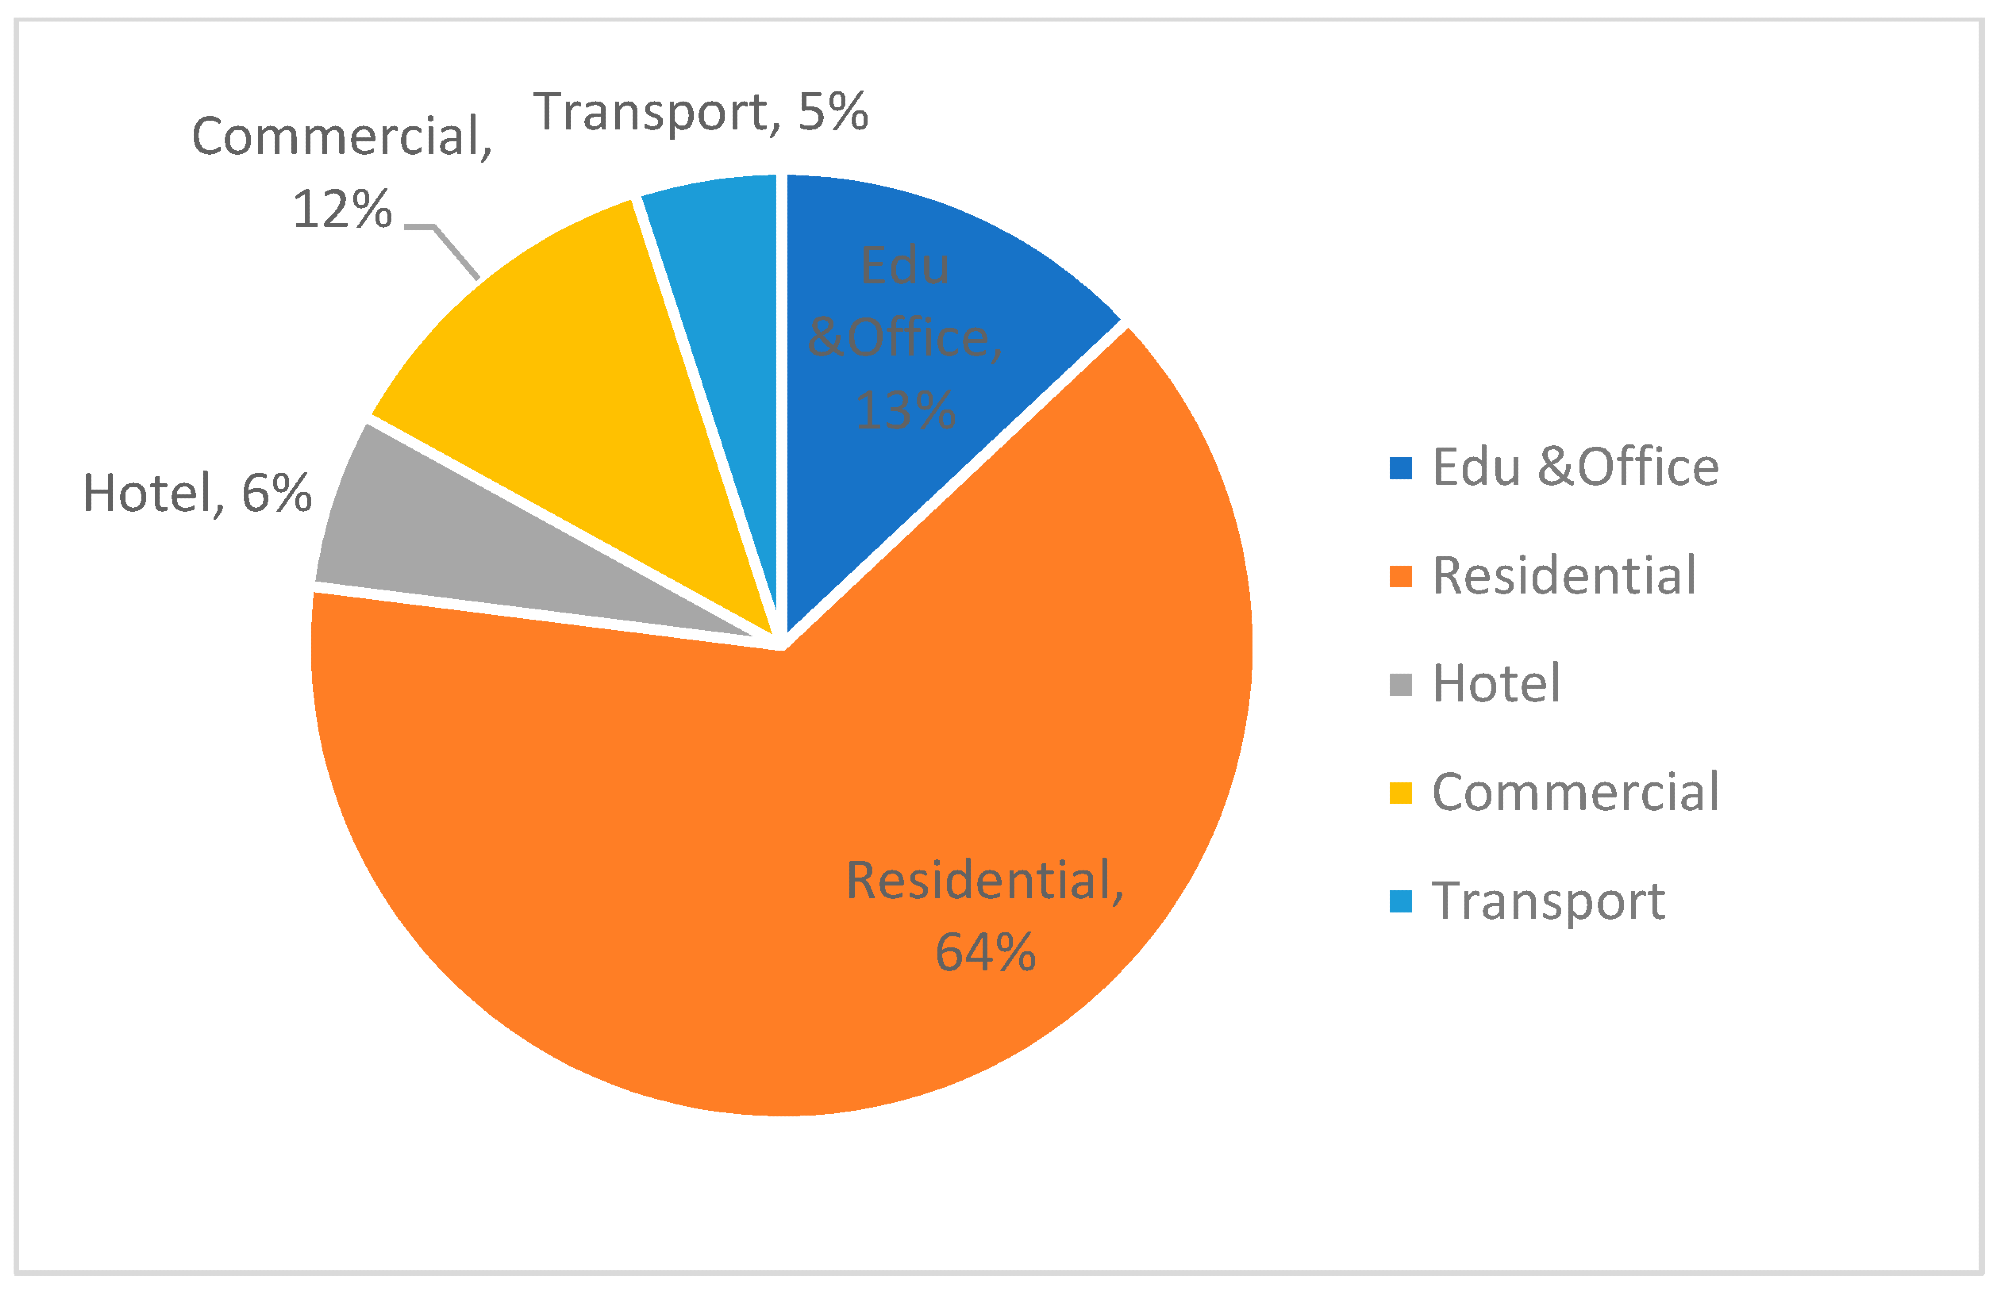
Figure 7. The proportion of building types in the areas for the study. Image Credit: Ji, et al., 2022
Table 4. Built-up area of individual block zone. Source: Ji, et al., 2022
| Land Zone |
Areas (ha) |
Building Type |
Built-Up Area (m2) |
| A |
25.1 |
Office |
22,645 |
| Commercial |
27,307 |
| Residential |
301,183 |
| Education |
12,176 |
| Hotel |
37,830 |
| Transport |
3386 |
| B1 |
5.6 |
Office |
15,562 |
| Commercial |
5696 |
| Hotels |
58,966 |
| Residential |
12,991 |
| B2 |
1.7 |
Office |
24,009 |
| C |
16.9 |
Transport |
242,281 |
| Commercial |
6872 |
| D1 |
6.2 |
Office |
71,747 |
| Commercial |
44,964 |
| Residential |
37,335 |
| D2 |
0.8 |
Commercial |
491 |
| Office |
6667 |
| E1 |
13.3 |
Office |
22,225 |
| Commercial |
14,866 |
| Residential |
246,434 |
| E2 |
12.8 |
Office |
7640 |
| Commercial |
15,957 |
| Education |
4932 |
| Residential |
246,705 |
| F1 |
7.2 |
Office |
16,971 |
| Commercial |
9155 |
| Residential |
108,627 |
| F2 |
4.6 |
Office and medical |
25,810 |
| Hotel |
2158 |
| Education |
7653 |
| Residential |
67,210 |
Modeling simulation is perhaps the most efficient method of predicting the energy usage of building blocks.
For modeling purposes, the buildings are classified into four categories, as shown in Figure 8. Education and office, commercial, domestic, transportation, and hotel are among them.
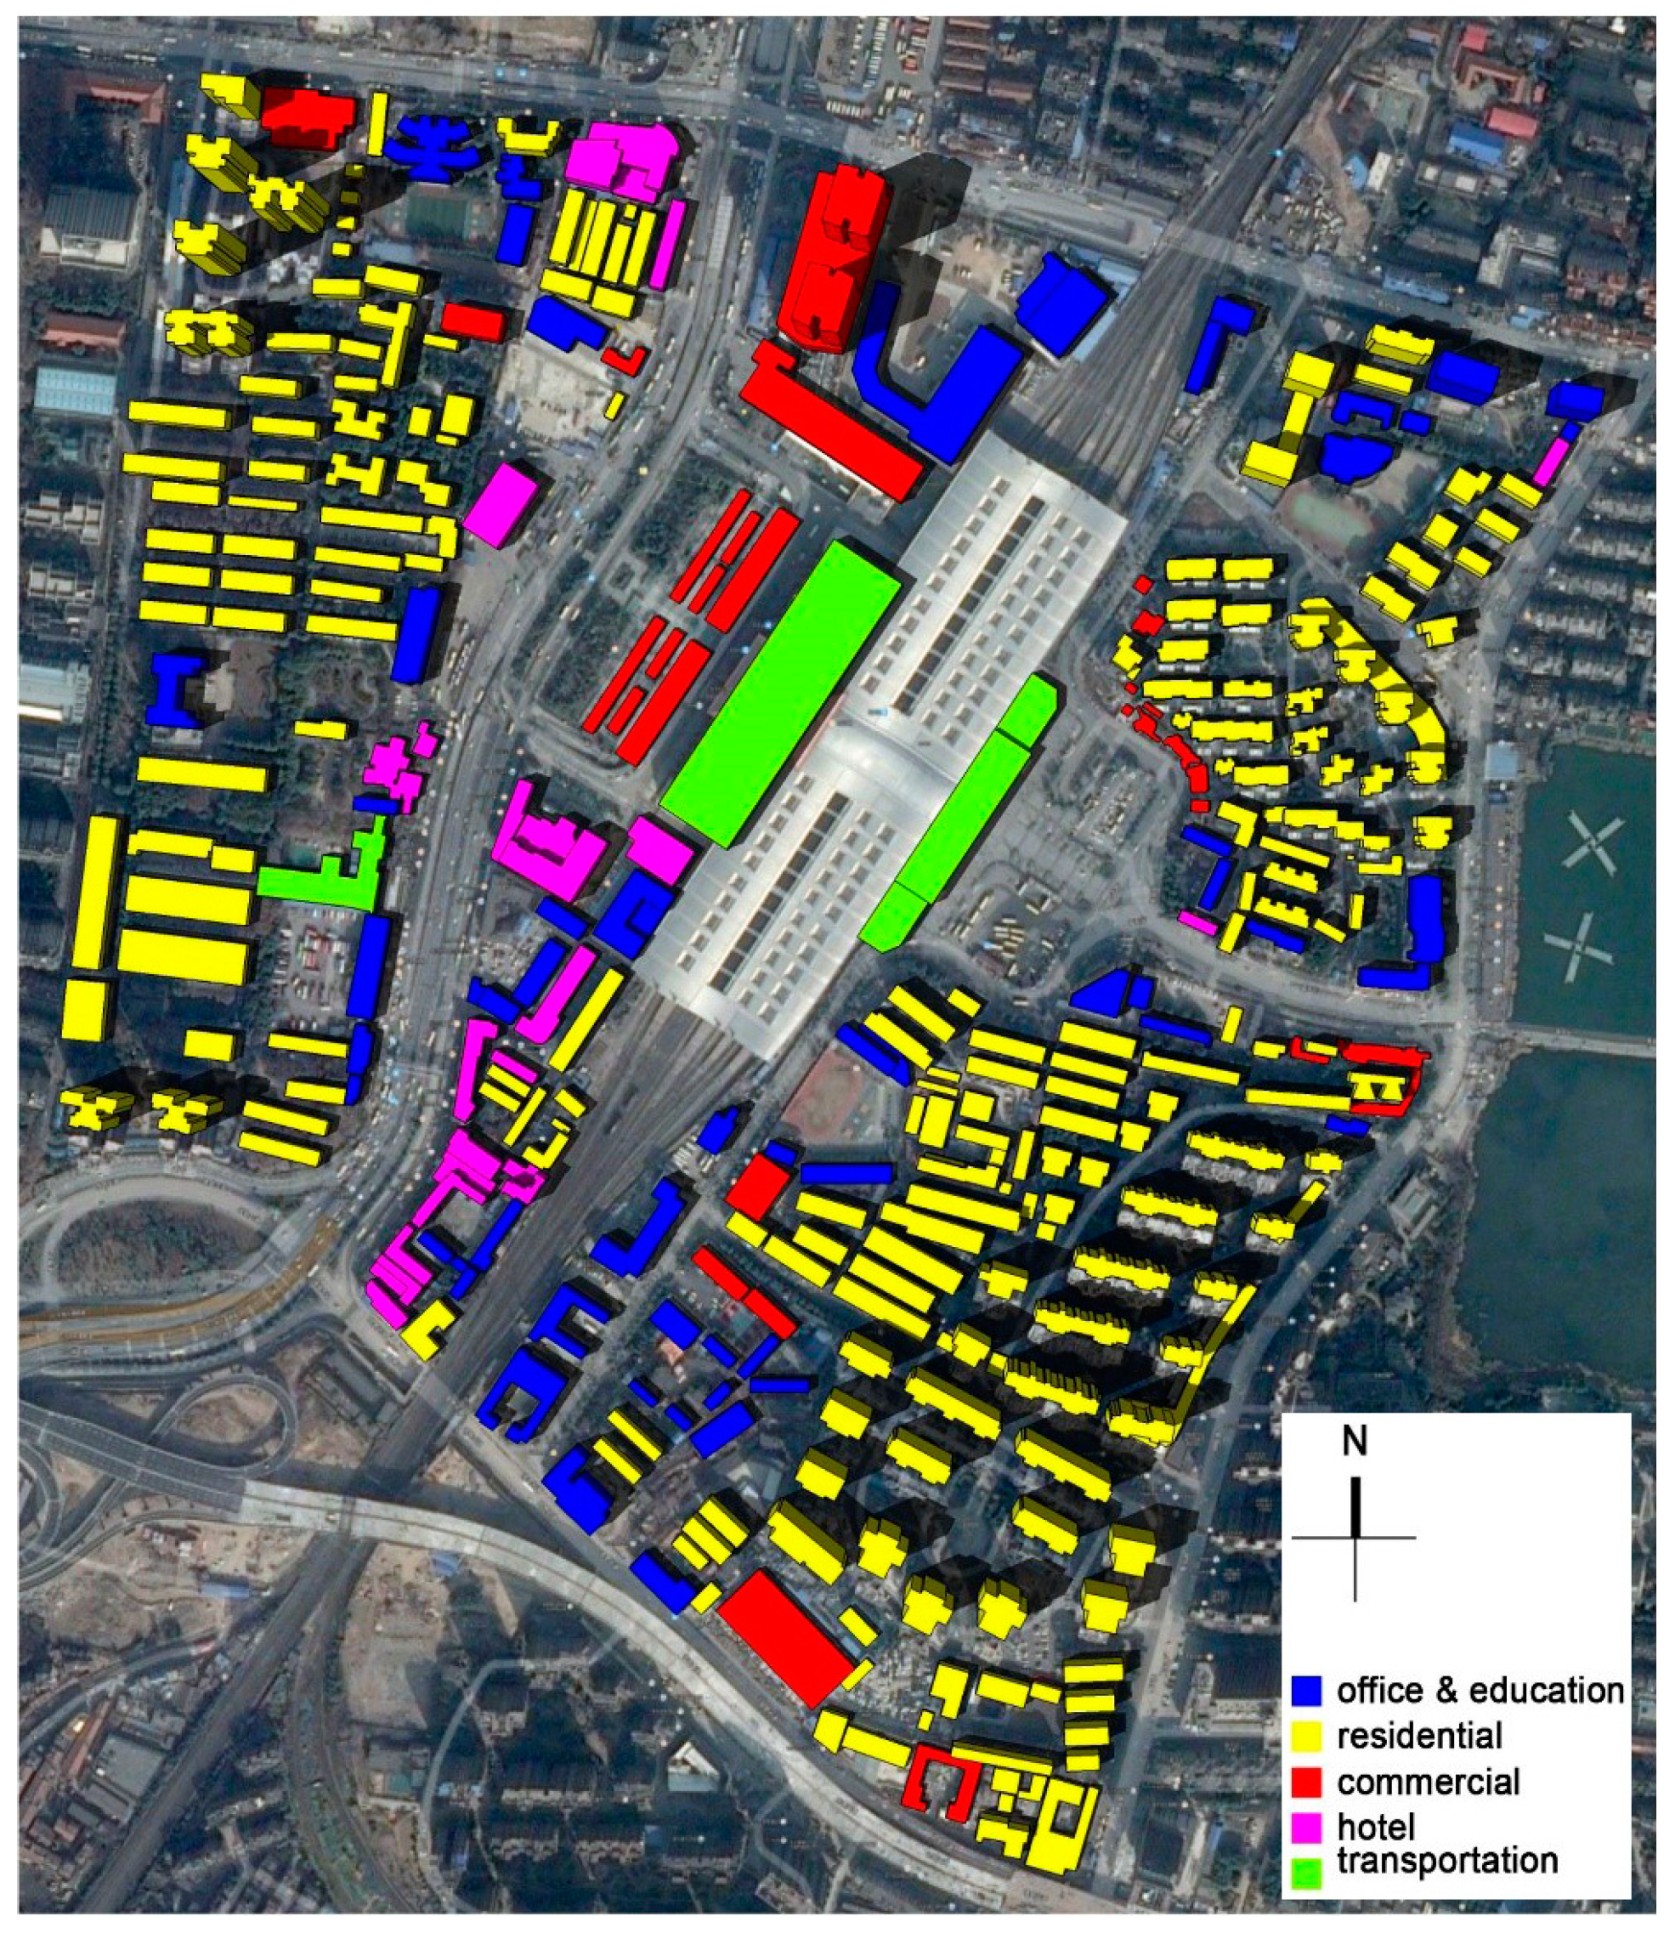
Figure 8. Modeling building stock with five building types in the study area. Image Credit: Ji, et al., 2022
Previous studies can be used to reference the details of the simulation setting caused by building constructions, data input and output are shown in Figure 9, and the operational schedule is set in Table 5.
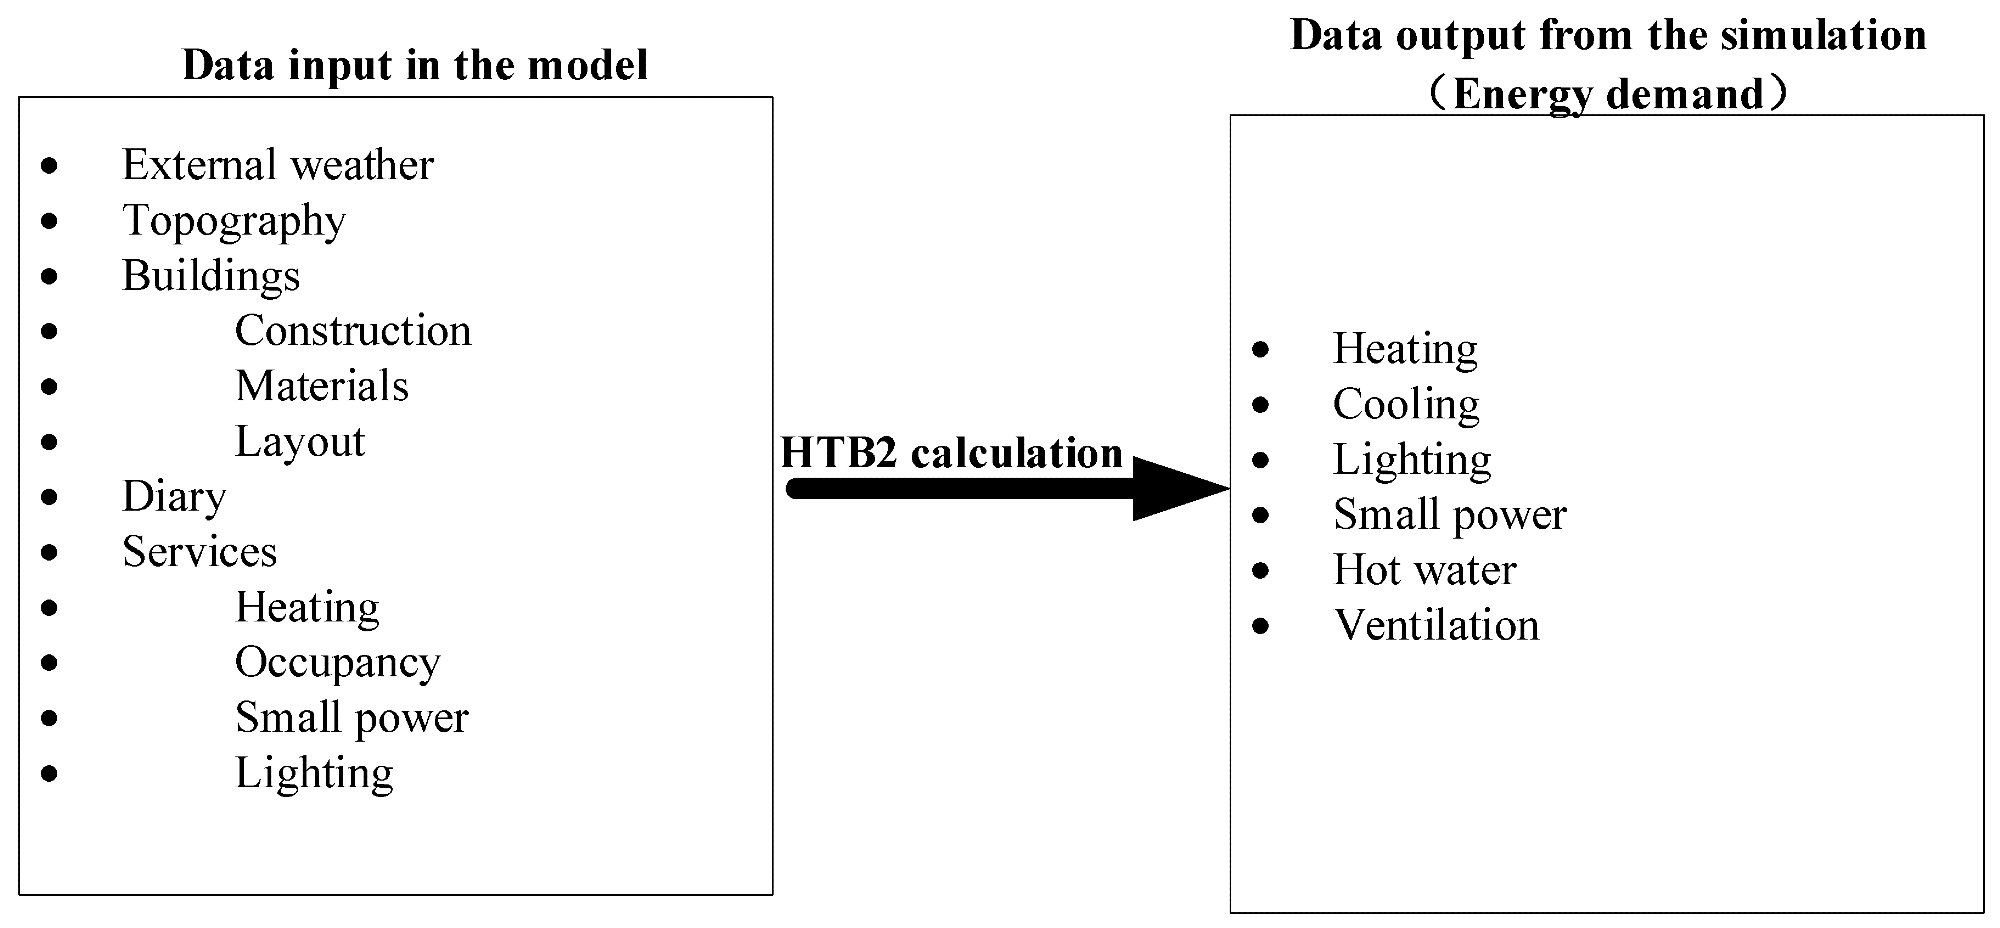
Figure 9. Data input to the data output of the model (HTB2 user manual 2.10). Image Credit: Ji, et al., 2022
Table 5. The parametric setting for urban building energy simulation (the design standard for energy efficiency of residential buildings in hot summer and cold winter zone (2010); the design standard for energy efficiency of public buildings (2015)). Source: Ji, et al., 2022
| |
Building Types |
Residential Building |
Hotel Building |
Commercial Building |
Office and Education Building |
Transportation Building |
| Parametric Setting |
|
| Heating/cooling schedule |
8 November–4 March;
6 May–8 September |
8 November–4 March;
6 May–8 September |
8 November–4 March;
6 May–8 September |
8 November–4 March;
6 May–8 September |
8 November–4 March;
6 May–8 September |
Mon–Fri 00:00–08:00 and 18:00–24:00
Sat–Sun 00:00–24:00 |
Mon–Sun
1:00–24:00 |
Mon–Sun
09:00–21:00 |
Mon–Fri
08:00–18:00 |
Mon–Sun
00:00–24:00 |
| Setpoint (°C) |
18/26 |
22/25 |
18/25 |
20/26 |
18/25 |
| Internal heat gains (occupancy, lighting, and small power) |
15 W/m2 |
25 W/m2 |
40 W/m2 |
20 W/m2 |
60 W/m2 |
| Air change per hour |
1.0 |
2.0 |
2.5 |
2.0 |
2.5 |
Results and Discussion
The simulation results in operational energy requirements from cooling and heating, as well as other components such as lighting, hot water, and small power, as shown in Figure 10. Energy consumption is influenced by building type, and electricity and natural gas are significant contributors to CO2 emissions.
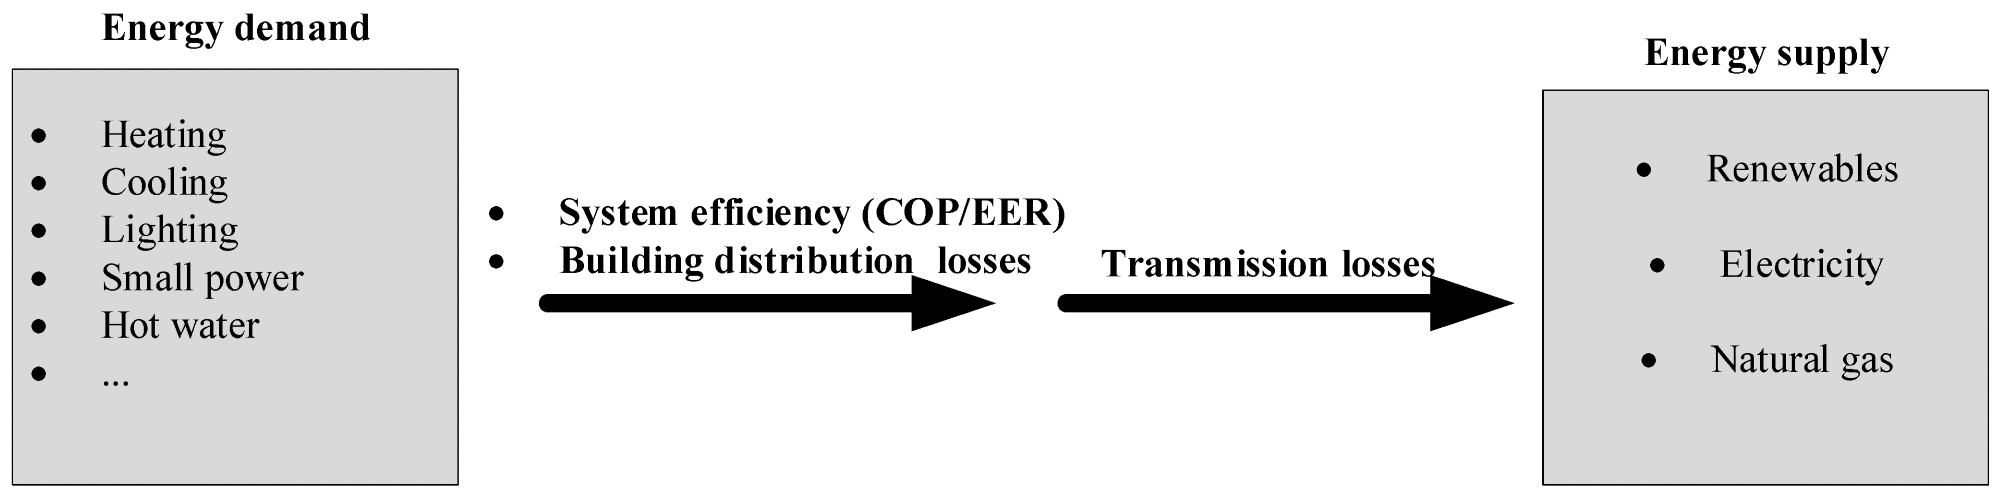
Figure 10. Data input to the data output of the model (HTB2 user manual 2.10). Image Credit: Ji, Q. 2018
Table 6 depicts the annual energy requirements for heating and cooling in five different building types. In the research region, there is a significant difference in the energy consumption for cooling and heating.
Table 6. The output of annual heating and cooling demands, based on five building functions. Source: Ji, et al., 2022
| Building Type |
Count |
Building Floor
Area
(m2) |
Heating Demand (kWh/
year) |
Cooling Demand (kWh/
year) |
Heating Demand (kWh/m2/
year) |
Cooling Demand (kWh/m2/
year) |
| Office and education |
40 |
187,121 |
2,813,697 |
−5,471,758 |
15 |
−29 |
| Residential |
141 |
918,681 |
7,878,151 |
−44,640,650 |
9 |
−49 |
| Hotel |
15 |
88,825 |
7484 |
−10,816,210 |
0 |
−122 |
| Commercial |
20 |
174,181 |
39,160 |
−16,007,554 |
2 |
−92 |
| Transport |
3 |
71,188 |
270,576 |
−17,117,151 |
4 |
−240 |
Figure 11 portrays the energy consumption of five different types of buildings. With minimal proportions, these are cooling, hot water, SPW (small power), lighting, ventilation, and heating.
Figure 11 also certainly shows that the power intensity (kWh/m2/a) of transportation and commercial properties is greater than that of residential and office buildings.
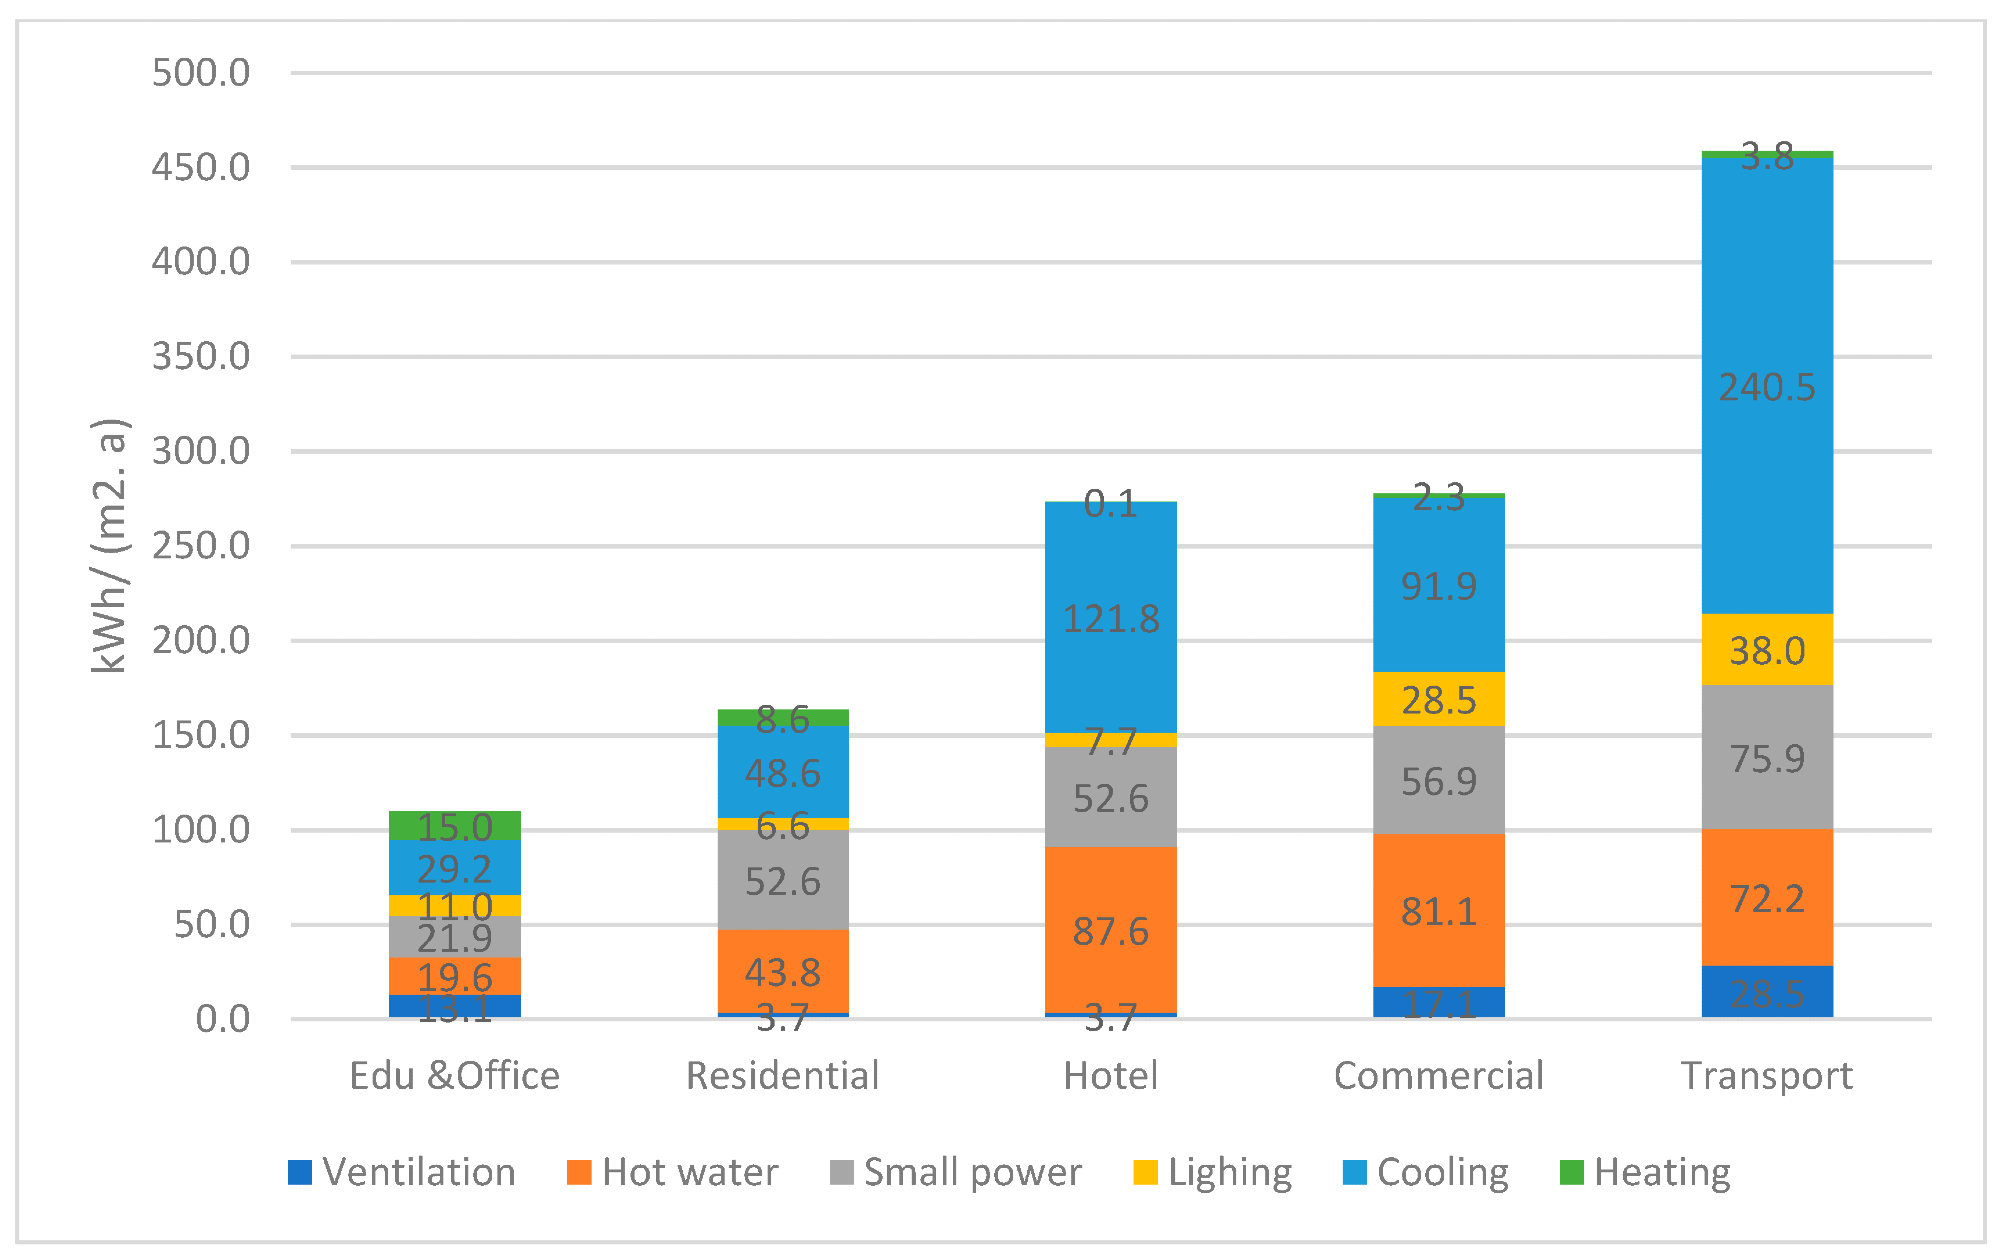
Figure 11. Energy demand by components of the five building types. Image Credit: Ji, et al., 2022
Table 7 contrasts the benchmark of energy use intensity to the modeling prediction results for transportation, commercial properties, hotels, office, and educational buildings—it is clear that the prediction findings were in accordance with the benchmark, with the exception of residential buildings, which are higher than the benchmark.
Table 7. Benchmarks of energy demand (kWh/(m2·a) in Wuhan. Source: Yu, et al., 2014
| Building Type |
Building Description |
Mean Value |
Standard Deviation |
Prediction |
| Residential |
Below 90 square meters |
60.1 |
32.2 |
163.8 |
Above 90 square meters area
(excluding luxury residential) |
43.9 |
32.2 |
Luxury residential |
91.3 |
21.8 |
| Office |
Standard office buildings
(using a centralized air-conditioning system) |
67.7 |
19.0 |
109.4 |
Standard office buildings
(using split air-conditioning) |
58.1 |
36.2 |
Government office buildings with
central air-conditioning system |
90.4 |
27.4 |
| Educational |
Kindergarten |
29.7 |
14.0 |
Primary school |
18.2 |
9.4 |
| Hotel |
Three stars and above |
233.1 |
114.6 |
273.3 |
Below three stars |
216.5 |
- |
| Commercial |
Large supermarket |
263.8 |
92.1 |
277.8 |
Large shopping malls |
207.9 |
106.6 |
Medium and small supermarket |
371.6 |
- |
Middle and small shopping malls |
207.6 |
- |
Shops |
43.2 |
- |
| Transport |
Bus terminal |
55.0 |
- |
458.8 |
Railway station |
469.6 |
- |
Conclusion
The modeling process in this study includes data inputs, modeling, and validation, and it utilizes physical-based, bottom-up methods to forecast urban building operational energy requirements. Physical-based, bottom-up models, on the other hand, are based on calculating each building’s energy consumption and can account for interconnections between buildings and the surrounding environment, such as shading effects.
To characterize each building, these models require a large amount of data and a substantial amount of computational effort. As a result, they are typically used for highly technical purposes like delivering superior data for energy planning, large-scale community retrofitting, and optimization.
Validation studies of urban building energy models for greater groups of buildings revealed a strong agreement with measurements, but simulation errors for individual buildings were considerably higher.
This study successfully forecasts energy demand from building stock at the urban level using an archetype physical-based, bottom-up procedure. It concludes by saying:
- It is possible to predict urban energy consumption from building stock using an archetypal physics-based, bottom-up strategy. The benchmark level, when compared to the predicted outcome, demonstrates that this is a viable and efficacious method.
- According to the findings, transportation and commercial buildings utilized significantly more energy than office and residential buildings. As a result, these two types of buildings will attract special attention in terms of energy savings.
- In Wuhan, cooling demand outnumbers heating demand across all building types. As a result, increasing system cooling efficiency is a top priority for energy savings.
Journal Reference
Ji, Q., Bi, Y., Makvandi, M., Deng, Q., Zhou, X., Li, C. (2022) Modelling Building Stock Energy Consumption at the Urban Level from an Empirical Study. Buildings, 12(3), p. 385. Available Online: https://www.mdpi.com/2075-5309/12/3/385/htm
References and Further Reading
- Hong, T., et al. (2020) Ten Questions on Urban Building Energy Modeling. Building and Environment, 168, p. 106508. doi.org/10.1016/j.buildenv.2019.106508.
- Ding, C., et al. (2019) Urban-Scale Building Energy Consumption Database: A Case Study for Wuhan, China. Energy Procedia, 158, pp. 6551–6556. doi.org/10.1016/j.egypro.2019.01.102.
- Statista China: Urbanisation. 2021. Available at: https://www.statista.com/statistics/270162/urbanization-in-china/ (.
- National Bureau of Statistics of China (2020) In: China Statistical Yearbook; China Statistics Press: Beijing, China.
- Wong, C. H. H., et al. (2021) Modelling Building Energy Use at Urban Scale: A Review on Their Account for the Urban Environment. Building and Environment, 205, p. 108235. doi.org/10.1016/j.buildenv.2021.108235.
- Hong, T., et al. (2018) Building Simulation: Ten Challenges. Building Simulation, 11, pp. 871–898. doi.org/10.1007/s12273-018-0444-x.
- Reinhart, C F & Cerezo Davila, C (2016) Urban Building Energy Modeling—A Review of a Nascent Field. Building and Environment, 97, pp. 196–202. doi.org/10.1016/j.buildenv.2015.12.001.
- Ferrando, M., et al. (2020) Urban Building Energy Modeling (UBEM) Tools: A State-of-the-Art Review of Bottom-up Physics-Based Approaches. Sustainable Cities and Society, 62, p. 102408. doi.org/10.1016/j.scs.2020.102408.
- Kavgic, M., et al. (2010) A Review of Bottom-up Building Stock Models for Energy Consumption in the Residential Sector. Building and Environment, 45(7), pp. 1683–1697. doi.org/10.1016/j.buildenv.2010.01.021.
- Swan, L G & Ugursal, V I (2009) Modeling of End-Use Energy Consumption in the Residential Sector: A Review of Modeling Techniques. Renewable and Sustainable Energy Reviews, 13(8), pp. 1819–1835. doi.org/10.1016/j.rser.2008.09.033.
- Zhao, H & Magoulès, F (2012) A Review on the Prediction of Building Energy Consumption. Renewable and Sustainable Energy Reviews, 16(6), pp. 3586–3592. doi.org/10.1016/j.rser.2012.02.049.
- Bentzen, J & Engsted, T (2001) A Revival of the Autoregressive Distributed Lag Model in Estimating Energy Demand Relationships. Energy, 26(1), pp. 45–55. doi.org/10.1016/S0360-5442(00)00052-9.
- Ali, U., et al. (2021) Review of Urban Building Energy Modeling (UBEM) Approaches, Methods and Tools Using Qualitative and Quantitative Analysis. Energy and Buildings, 246, p. 111073. doi.org/10.1016/j.enbuild.2021.111073.
- Huo, T., et al. (2019) Estimating Urban Residential Building-Related Energy Consumption and Energy Intensity in China Based on Improved Building Stock Turnover Model. Science of The Total Environment, 650(P.1), pp. 427–437. doi.org/10.1016/j.scitotenv.2018.09.008.
- Li, W., et al. (2017) Modeling Urban Building Energy Use: A Review of Modeling Approaches and Procedures. Energy, 141, pp. 2445–2457. doi.org/10.1016/j.energy.2017.11.071.
- Shorrock, L D & Dunster, J E (1997) The Physically-Based Model BREHOMES and Its Use in Deriving Scenarios for the Energy Use and Carbon Dioxide Emissions of the U.K. Housing Stock. Energy Policy, 25(12), pp. 1027–1037. doi.org/10.1016/S0301-4215(97)00130-4.
- Ferrando, M & Causone, F (2020) An Overview of Urban Building Energy Modelling (UBEM) Tools. In: Building Simulation Conference Proceedings, 16, pp. 3452–3459. Available at: http://hdl.handle.net/11311/1152230
- Heiple, S & Sailor, D J (2008) Using Building Energy Simulation and Geospatial Modeling Techniques to Determine High Resolution Building Sector Energy Consumption Profiles. Energy and Buildings, 40(8), pp. 1426–1436. doi.org/10.1016/j.enbuild.2008.01.005.
- Lim, H & Zhai, Z J (2017) Review on Stochastic Modeling Methods for Building Stock Energy Prediction. Building Simulation, 10, pp. 607–624. doi.org/10.1007/s12273-017-0383-y.
- Foliente, G & Seo, S (2012) Modelling Building Stock Energy Use and Carbon Emission Scenarios. Smart and Sustainable Built Environment, 1(2), pp. 118–138. doi.org/10.1108/20466091211260578.
- Sun, K., et al. (2016) A Pattern-Based Automated Approach to Building Energy Model Calibration. Applied Energy, 165, pp. 214–224. doi.org/10.1016/j.apenergy.2015.12.026.
- Chong, A., et al. (2017) Bayesian Calibration of Building Energy Models with Large Datasets. Energy and Buildings, 154, pp. 343–355. doi.org/10.1016/j.enbuild.2017.08.069.
- O’Neill, Z & Eisenhower, B (2013) Leveraging the Analysis of Parametric Uncertainty for Building Energy Model Calibration. Building Simulation, 6, pp. 365–377. doi.org/10.1007/s12273-013-0125-8.
- Yang, T., et al. (2016) An Automated Optimisation Method for Calibrating Building Energy Simulation Models with Measured Data: Orientation and a Case Study. Applied Energy, 179, pp. 1220–1231. doi.org/10.1016/j.apenergy.2016.07.084.
- Monetti, V., et al. (2015) Calibration of Building Energy Simulation Models Based on Optimisation: A Case Study. Energy Procedia, 78, pp. 2971–2976. doi.org/10.1016/j.egypro.2015.11.693.
- Fonseca, J A & Schlueter, A (2015) Integrated Model for Characterisation of Spatiotemporal Building Energy Consumption Patterns in Neighborhoods and City Districts. Applied Energy, 142, pp. 247–265. doi.org/10.1016/j.apenergy.2014.12.068.
- Sokol, J., et al. (2017) Validation of a Bayesian-Based Method for Defining Residential Archetypes in Urban Building Energy Models. Energy and Buildings, 134, pp. 11–24. doi.org/10.1016/j.enbuild.2016.10.050.
- Jones, P., et al. (2007) Modelling the Built Environment at an Urban Scale—Energy and Health Impacts in Relation to Housing. Landscape and Urban Planning, 83(1), pp. 39–49. doi.org/10.1016/j.landurbplan.2007.05.015.
- Huang, J., et al. (2017) An Integrated Model for Urban Microclimate and Building Energy in High-Density Cities for Early Stage Design. In: Building Simulation 2017: 15th Conference of International Building Performance Simulation Association, San Francisco, CA, USA, 7–9 August 2017. Available at: https://orca.cardiff.ac.uk/id/eprint/104125/
- Ji, Q (2018) Investigating Low Carbon Development of High-Density Building Clusters Located around Railway Passenger Transport Hubs in China. Ph.D. Thesis, Cardiff University, Cardiff, UK. Available at: https://orca.cardiff.ac.uk/id/eprint/117955/
- Bassett, T., et al. (2012) Calculating the Solar Potential of the Urban Fabric with SketchUp and HTB2. In: Solar Building Skins. Bressanone, Italy, 6–7 December. Available at: https://orca.cardiff.ac.uk/id/eprint/41395/
- Yu, Y., et al. (2014) Study on energy consumption quota of civil buildings in Wuhan. Building Science, 30(8), pp. 106–112.
- Dall’O’, G., et al. (2012) A Methodology for the Energy Performance Classification of Residential Building Stock on an Urban Scale. Energy and Buildings, 48, pp. 211–219. doi.org/10.1016/j.enbuild.2012.01.034.