Jun 22 2022
The inclusion of polyvinyl alcohol (PVA) fiber in concrete improves its toughness significantly, according to previous research. The mechanical and thermal performance of polyvinyl alcohol fiber reinforced cement composites (GPCC) were examined in a recent study in the journal Buildings. This study lays the groundwork for future research into the use of GPCC and proposes a mixed proportion that is optimal.
Study: Influence of Glazed Hollow Bead on the Performance of Polyvinyl Alcohol Fiber Reinforced Cement Composites. Image Credit: Okaycm'Stocker/Shutterstock.com
The topic of energy conservation in buildings has risen to prominence in recent years. Building energy consumption has risen to 40% of total global energy consumption as a result of urbanization and population growth.
Lately, energy conservation initiatives in buildings have been suggested as a means to mitigate global warming caused due to high energy consumption and carbon use to decrease greenhouse gas emissions by 2030, as required by the Paris Agreement. Building heating and cooling account for a significant portion of total energy consumption.
Cementitious materials comprising glazed hollow bead (GHB) were investigated extensively in terms of thermal insulation composites. According to studies, adding the right amount of glass beads to concrete can significantly improve the material’s thermal insulation capacity.
However, since the glass beads have a spherical structure on the outside, they are easily broken during the concrete mixing process by extrusion and vibration, leading to a loss of strength. Brittle damage is a possibility, which limits its application.
Introducing the correct amount of uniform anisotropic distribution of fibers in concrete to overcome brittleness has become an effective way of improving the toughness of concrete. The majority of existing research focuses on GHB insulating concrete and fiber concrete, but few investigations on fiber-glass bead cementitious composites exist.
A novel material with excellent load-bearing performance, heat insulation, and crack resistance for buildings, particularly for special structures (such as storage structures), is required to meet the demands of energy conservation and green development.
The inclusion of polyvinyl alcohol (PVA) fiber in concrete improves its toughness significantly, according to previous research and references. The mechanical and thermal performance of polyvinyl alcohol fiber reinforced cement composites (GPCC) were examined. This study lays the groundwork for future research into the use of GPCC and proposes a mixed proportion that is optimal.
Methodology
The experiment was carried out with ordinary silicate cement of grade P-O 42.5. A power plant produced I grade fly ash was used. Fine aggregates are made from natural river sand with an optimum particle diameter of 1.18 mm. The fibers are made of polyvinyl alcohol fibers (PVA). The appearance and SEM image are revealed in Figure 1 and Table 1.
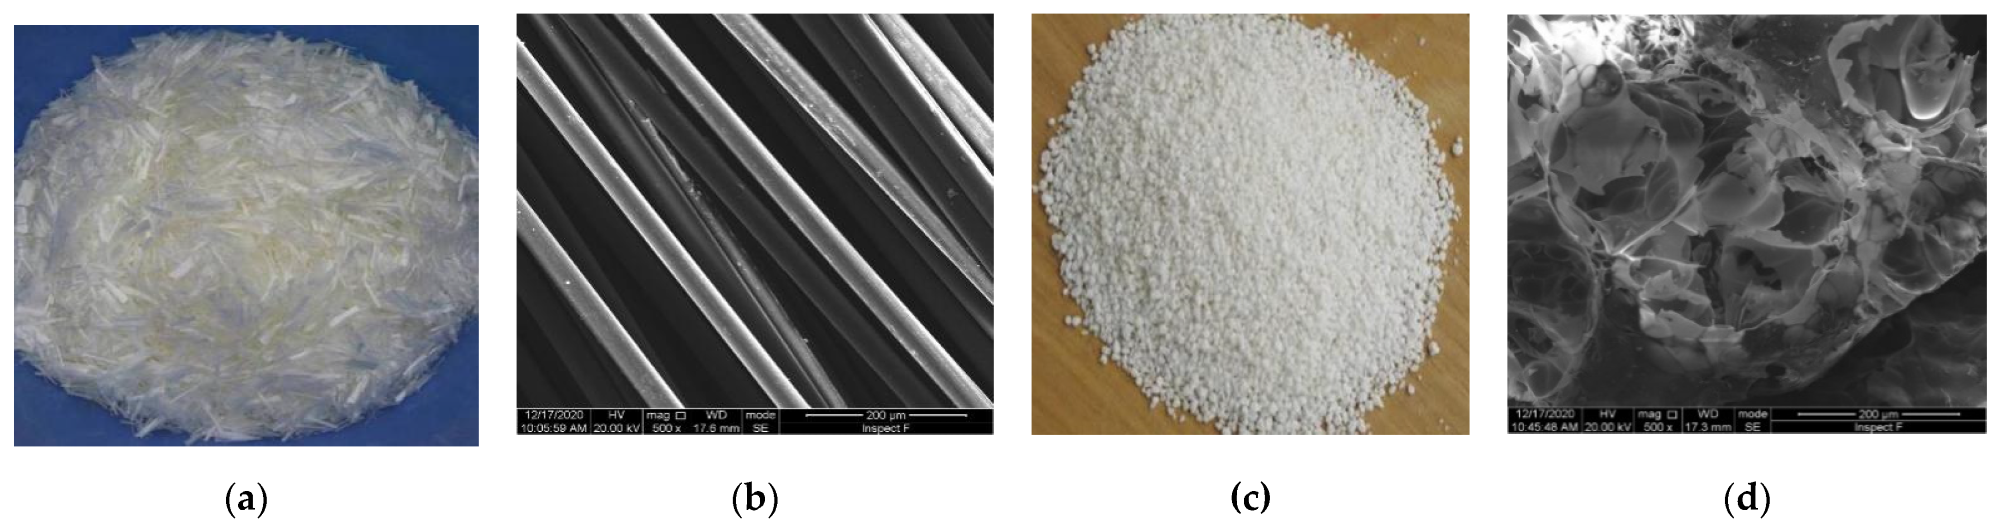
Materials: (a) PVA fibers; (b) SEM image of PVA fiber; (c) GHB; (d) SEM image of GHB. Image Credit: Dai, J., et al., 2022
Table 1. The properties of PVA fiber. Source: Dai, J., et al., 2022
Length
(mm) |
Diameter
(µm) |
Tensile Strength
(MPa) |
Elastic Modulus
(GPa) |
Elongation
(%) |
Density
(g/cm3) |
| 12.8 |
39 |
1600 |
40 |
7 |
1.3 |
The performance indexes of GHB are depicted in Table 2.
Table 2. The properties of GHB. Source: Dai, J., et al., 2022
Particle Size
(mm) |
Bulk Density
(kg·m-3) |
Thermal Conductivity
(W/(m·K)) |
Refractory Temperature
(°C) |
Cylinder Compressive Strength
(Volume Loss Rate at 1 MPa Pressure) |
Water Absorption
(%) |
| 0.5–1.5 |
80–130 |
0.032–0.045 |
1280–1360 |
38–46% |
20–50 |
The test was conducted using the orthogonal design table of three factors and mix levels, according to the GPCC pre-testing results. GHBs have been used in place of fine aggregates, and the orthogonal test’s influential factors are GHB content, PVA fiber content, and water-binder ratio. The orthogonal experiment’s factors and levels are listed in Table 3.
Table 3. Factor and level of the orthogonal experiments. Source: Dai, J., et al., 2022
| Factor |
Lever |
| 1 |
2 |
3 |
4 |
5 |
6 |
| A |
GHB |
20% |
40% |
60% |
80% |
100% |
120% |
| B |
PVA |
1.0% |
1.5% |
2.0% |
|
|
|
| C |
Water-binder ratio |
0.26 |
0.3 |
0.34 |
|
|
|
Table 4 shows the mix proportions and test results.
Table 4. Mix proportions and test results. Source: Dai, J., et al., 2022
Test
No |
A |
B |
C |
Fly
Ash |
Cement |
Sand |
Compressive
Strength
(MPa) |
Split Tensile
Strength
(MPa) |
Thermal
Conductivity
(W/(m·K)) |
GHB
(%) |
PVA
(%) |
Water |
| 1 |
20 |
1.0 |
0.34 |
0.5 |
0.5 |
0.36 |
24.63 |
3.73 |
0.8967 |
| 2 |
20 |
1.5 |
0.26 |
0.5 |
0.5 |
0.36 |
36.33 |
5.20 |
0.8714 |
| 3 |
20 |
2.0 |
0.30 |
0.5 |
0.5 |
0.36 |
30.23 |
4.60 |
0.8532 |
| 4 |
40 |
1.0 |
0.30 |
0.5 |
0.5 |
0.36 |
29.57 |
5.40 |
0.7399 |
| 5 |
40 |
1.5 |
0.34 |
0.5 |
0.5 |
0.36 |
26.17 |
4.03 |
0.7571 |
| 6 |
40 |
2.0 |
0.26 |
0.5 |
0.5 |
0.36 |
31.63 |
4.10 |
0.7643 |
| 7 |
60 |
1.0 |
0.26 |
0.5 |
0.5 |
0.36 |
31.30 |
3.68 |
0.7447 |
| 8 |
60 |
1.5 |
0.30 |
0.5 |
0.5 |
0.36 |
36.80 |
3.87 |
0.6748 |
| 9 |
60 |
2.0 |
0.34 |
0.5 |
0.5 |
0.36 |
20.77 |
2.80 |
0.7145 |
| 10 |
80 |
1.0 |
0.26 |
0.5 |
0.5 |
0.36 |
20.90 |
3.47 |
0.6517 |
| 11 |
80 |
1.5 |
0.30 |
0.5 |
0.5 |
0.36 |
25.53 |
3.42 |
0.6351 |
| 12 |
80 |
2.0 |
0.34 |
0.5 |
0.5 |
0.36 |
17.10 |
2.77 |
0.6300 |
| 13 |
100 |
1.0 |
0.30 |
0.5 |
0.5 |
0.36 |
13.77 |
2.73 |
0.6305 |
| 14 |
100 |
1.5 |
0.34 |
0.5 |
0.5 |
0.36 |
22.63 |
2.67 |
0.6733 |
| 15 |
100 |
2.0 |
0.26 |
0.5 |
0.5 |
0.36 |
25.90 |
4.00 |
0.7651 |
| 16 |
120 |
1.0 |
0.34 |
0.5 |
0.5 |
0.36 |
17.10 |
2.43 |
0.7060 |
| 17 |
120 |
1.5 |
0.26 |
0.5 |
0.5 |
0.36 |
17.70 |
3.40 |
0.6555 |
| 18 |
120 |
2.0 |
0.30 |
0.5 |
0.5 |
0.36 |
17.13 |
3.47 |
0.7864 |
Prior to the mechanical and thermal conductivity tests, the specimens were prepared. The compressive, split, and thermal conductivity of GPCC were all tested, as well as the microstructure images (Figure 2).
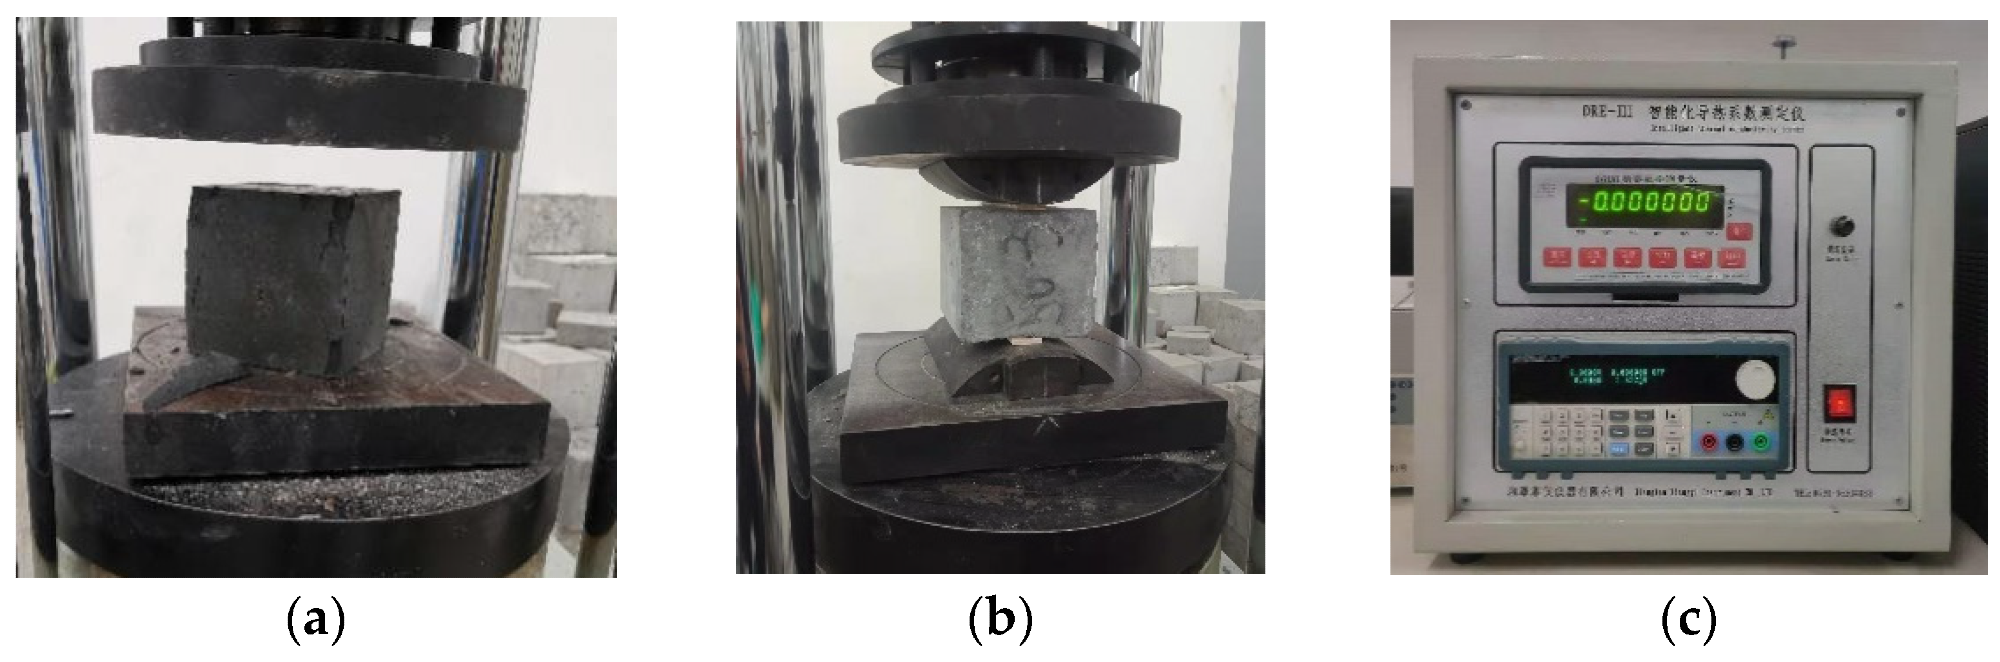
Figure 2. The test apparatus and loading: (a) compressive strength; (b) split tensile strength; (c) thermal conductivity. Image Credit: Dai, J., et al., 2022
A scanning electron microscope was used to examine the specimen’s microstructure. The sample was collected without coarse aggregate to analyze the microscopic morphology of the GHB and PVA fibers in the concrete.
Results and Discussion
The order of each factor’s influence on the evaluation index, as shown in Table 5 and Figure 3, will be intuitively shown using range analysis.
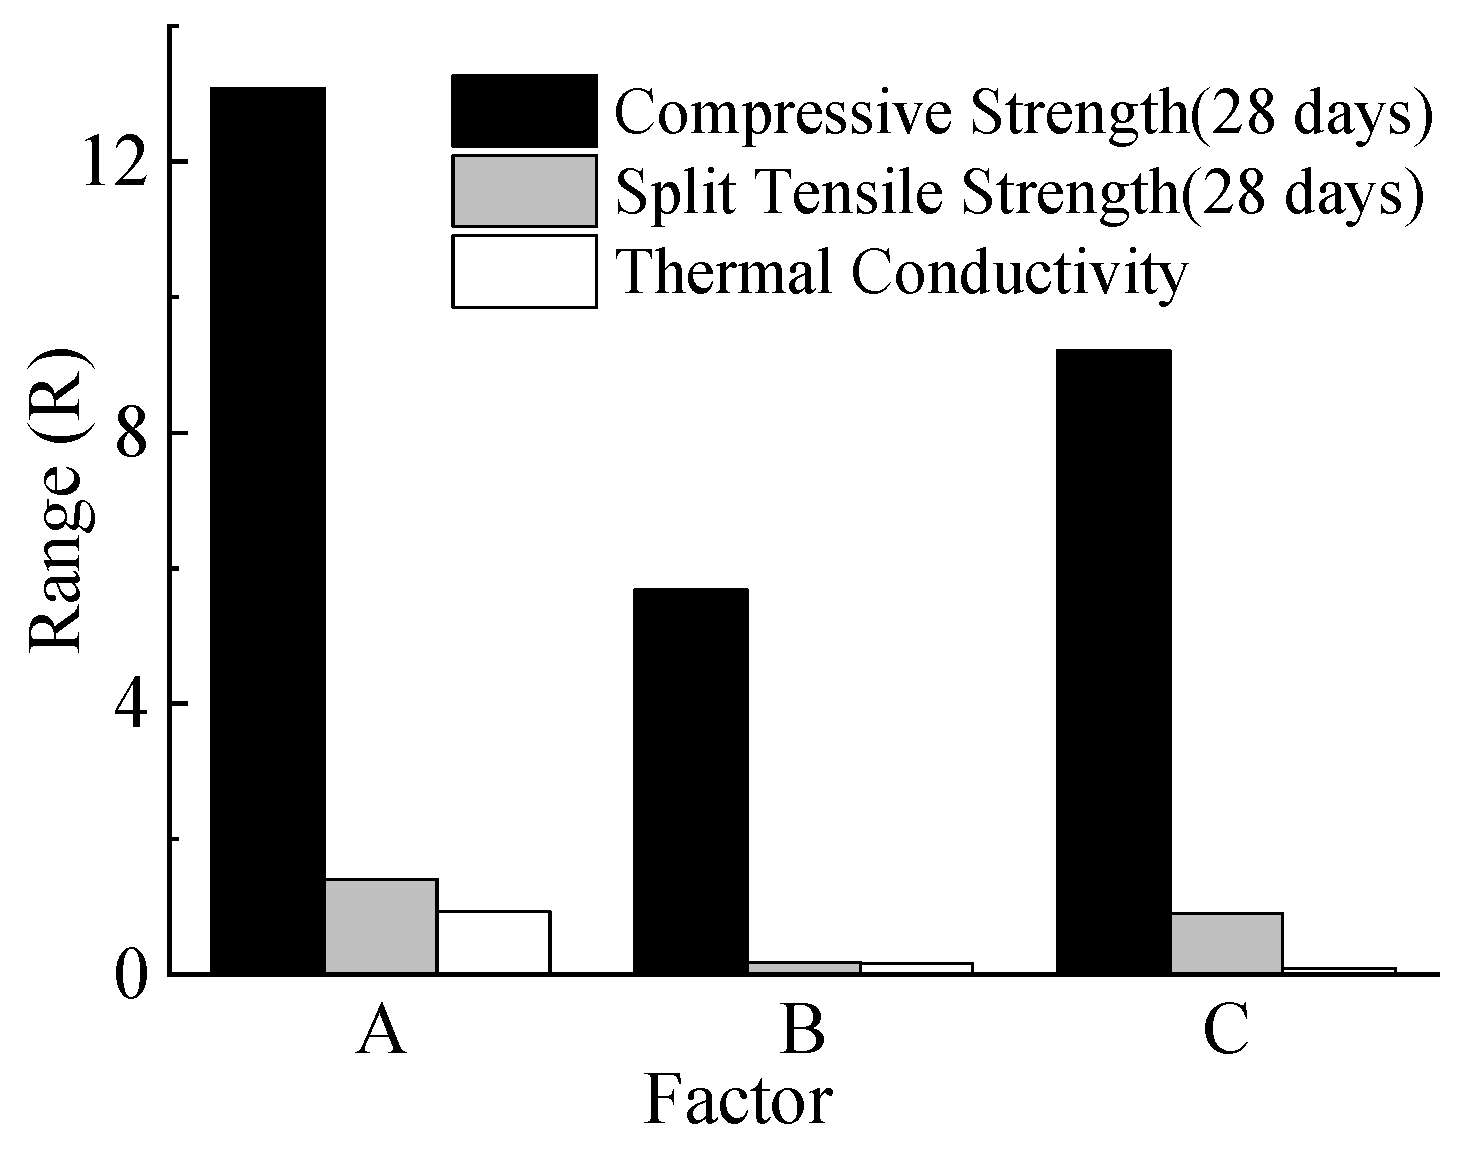
Figure 3. Range chart. Image Credit: Dai, J., et al., 2022
Table 5. Analysis results of range. Source: Dai, J., et al., 2022
| Number |
Compressive Strength
(MPa) |
Split Tensile Strength
(MPa) |
Thermal Conductivity
(W/(m·K)) |
| A |
B |
C |
A |
B |
C |
A |
B |
C |
| K1 |
91.20 |
137.27 |
163.77 |
13.53 |
21.45 |
23.85 |
2.6213 |
4.3696 |
4.4527 |
| K2 |
87.37 |
165.17 |
153.03 |
13.53 |
22.59 |
23.49 |
2.2613 |
4.2671 |
4.3199 |
| K3 |
88.87 |
142.77 |
128.40 |
10.35 |
21.73 |
18.43 |
2.1340 |
4.5135 |
4.3776 |
| K4 |
63.53 |
|
|
9.65 |
|
|
1.9168 |
|
|
| K5 |
62.30 |
|
|
9.40 |
|
|
2.0688 |
|
|
| K6 |
51.93 |
|
|
9.30 |
|
|
2.1479 |
|
|
| K1 |
30.40 |
22.88 |
27.30 |
4.51 |
3.57 |
3.97 |
0.8738 |
0.7283 |
0.7421 |
| K2 |
29.12 |
27.53 |
25.51 |
4.51 |
3.77 |
3.92 |
0.7538 |
0.7112 |
0.7200 |
| K3 |
29.62 |
23.80 |
21.4 |
3.45 |
3.62 |
3.07 |
0.7113 |
0.7522 |
0.7296 |
| K4 |
21.18 |
|
|
3.22 |
|
|
0.6389 |
|
|
| K5 |
20.77 |
|
|
3.13 |
|
|
0.6896 |
|
|
| K6 |
17.31 |
|
|
3.10 |
|
|
0.7160 |
|
|
| R |
13.09 |
5.68 |
9.21 |
1.41 |
0.19 |
0.90 |
0.2348 |
0.0411 |
0.0221 |
Note: The number after the letter represents the corresponding level of each factor. Ki represents the sum of the experimental results corresponding to the level value of i in any column of factors.
The compressive strength decreased as GHB increased, as shown in Figure 4a. The porous cavity structure within the GHB is to be held responsible for this. The effect of the water-binder ratio on the compressive strength of GPCC is also obvious, as shown in Figure 4c, as the main factor affecting matrix compactness.
Meanwhile, because fiber content has so little impact on the compactness of the matrix, as depicted in Figure 4b, the effect of fiber content is not obvious. A1-B3-C1 is the best solution.
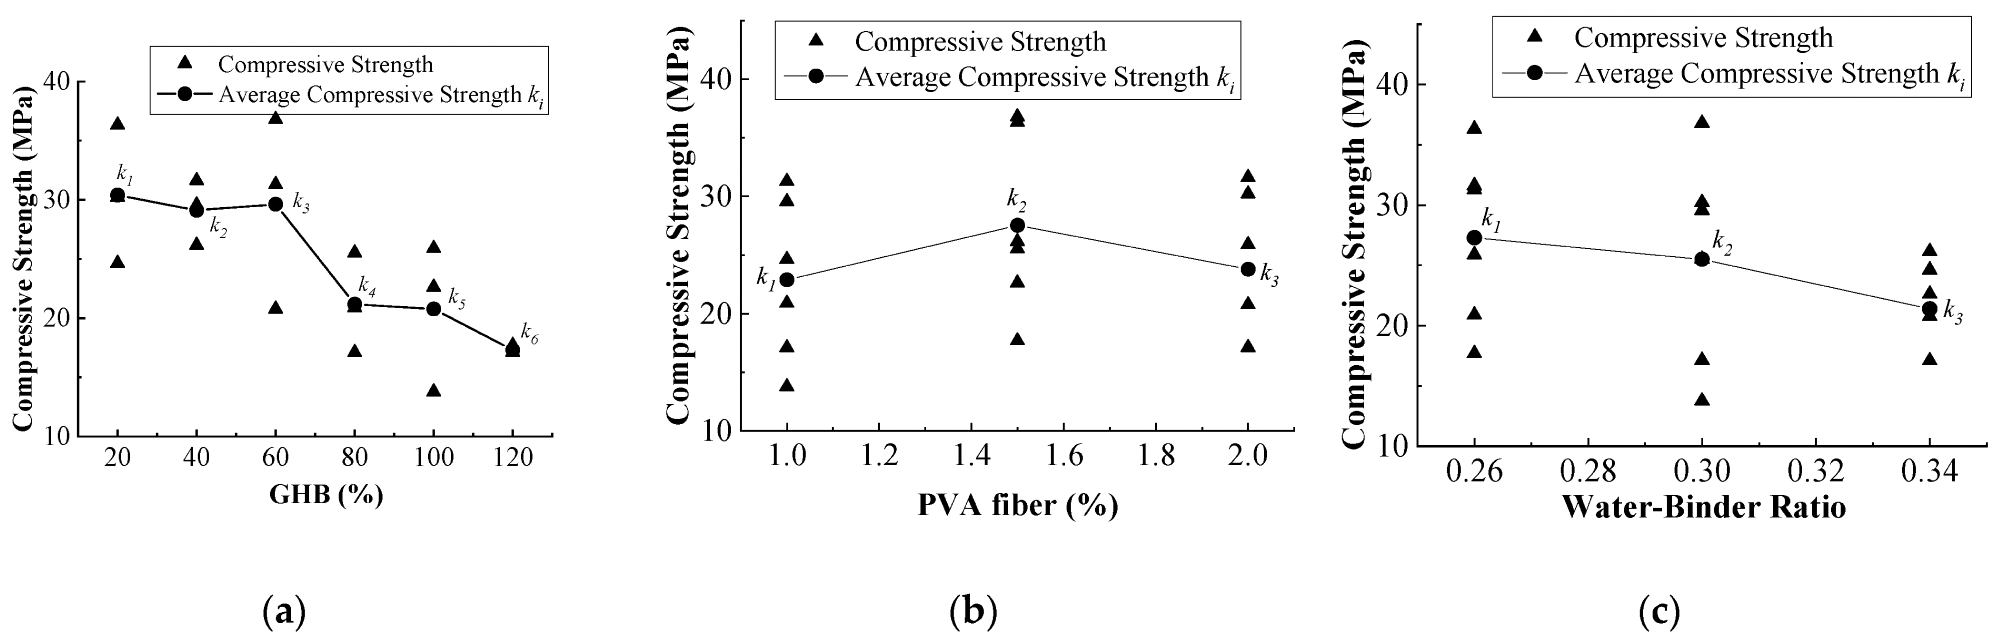
Figure 4. Relationship of GPCC compressive strength with each factor: (a) GHB content; (b) PVA fiber content; (c) water-binder ratio. Image Credit: Dai, J., et al., 2022
As shown in Figure 5, the affecting ranking for split tensile strength is: water-binder ratio > GHB content > PVA fiber content. The influence of the water-binder ratio and GHB content is more noticeable. A1-B2-C1 is the best solution.
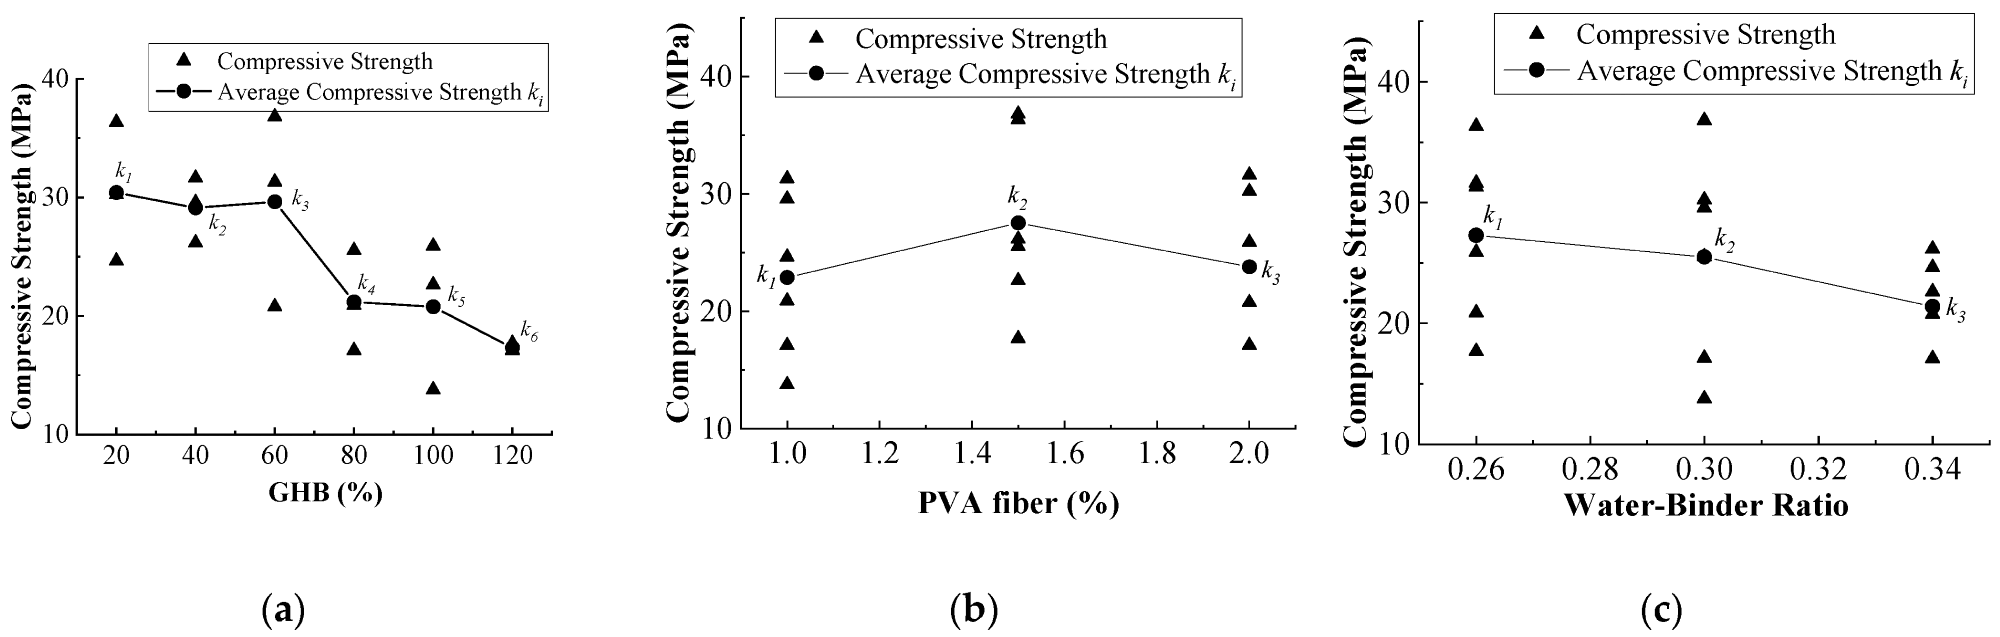
Figure 5. Relationship of GPCC split tensile strength with each factor: (a) GHB content; (b) PVA fiber content; (c) water-binder ratio. Image Credit: Dai, J., et al., 2022
The following factors influence thermal conductivity: GHB content > PVA fiber content > water-binder ratio (Figure 6). A4-B2-C2 is the best solution.
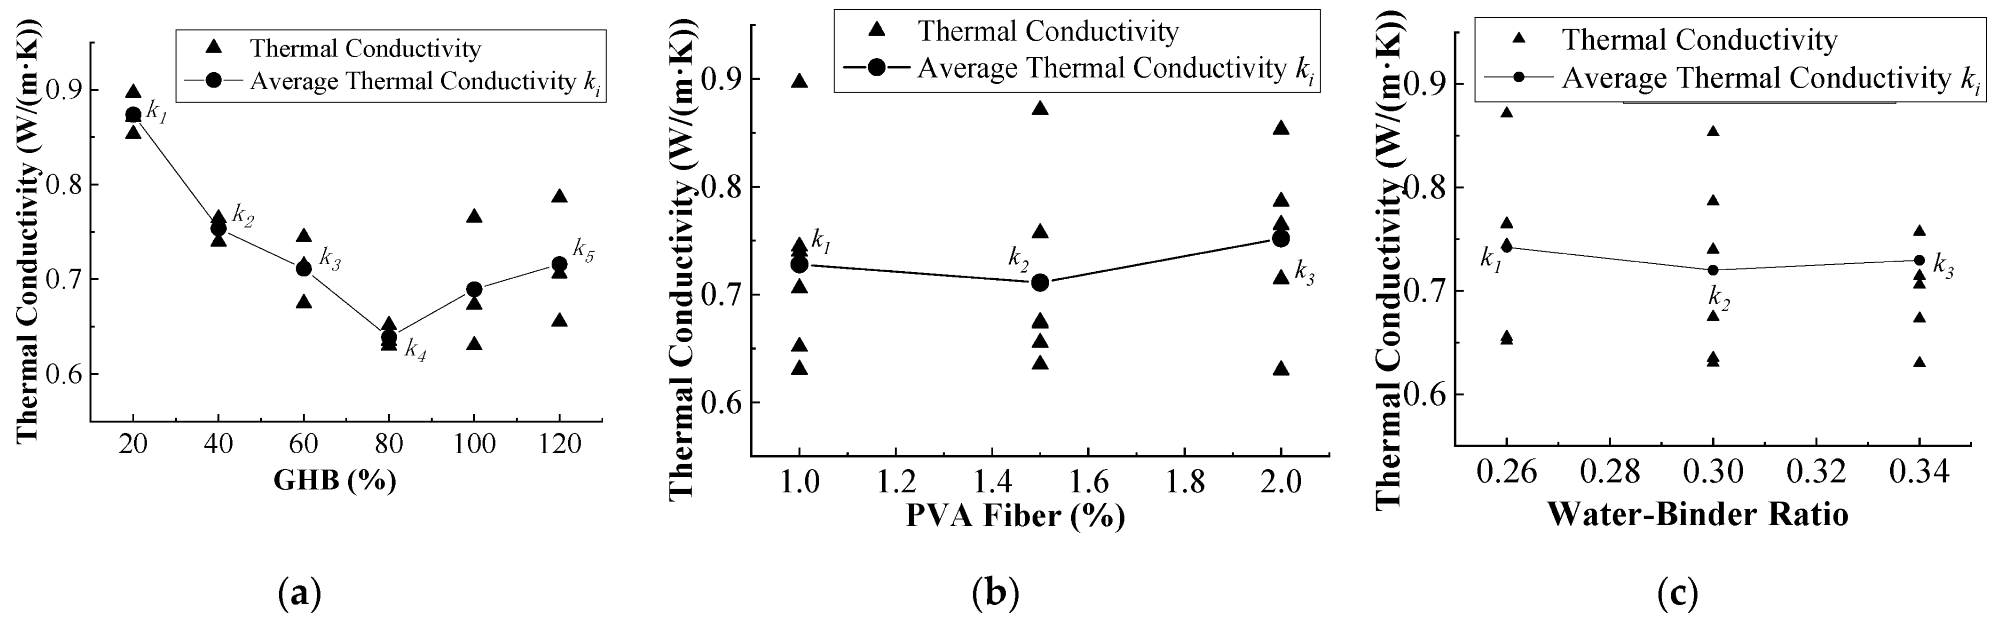
Figure 6. Relationship of GPCC thermal conductivity with each factor: (a) GHB content; (b) PVA fiber content; (c) water-binder ratio. Image Credit: Dai, J., et al., 2022
According to the range analysis, the content of GHB has the greatest impact on the mechanical properties and thermal insulation of GPCC, while the water-binder ratio has the greatest impact on the strength of GPCC via its matrix. In Tables 6, 7, and 8, the results were analyzed using variance analysis to more accurately evaluate the importance of these factors.
Table 6. Variance analysis results of compressive strength. Source: Dai, J., et al., 2022
| Factors |
Compressive Strength |
| SS |
Df |
MS |
F |
Significance |
| GHB |
476.22 |
5 |
95.24 |
5.12 |
* |
| PVA fiber |
72.80 |
2 |
36.40 |
1.96 |
- |
| Water-binder ratio |
109.60 |
2 |
54.80 |
2.95 |
- |
| Intra-group errors |
148.82 |
8 |
18.60 |
- |
- |
| Sum |
807.52 |
17 |
205.04 |
- |
- |
Note: “*” represents a significant effect of this factor on the results.
Table 7. Variance analysis results of split tensile strength. Source: Dai, J., et al., 2022
| Factors |
Split Tensile Strength |
| SS |
Df |
MS |
F |
Significance |
| GHB |
6.84 |
5 |
1.37 |
5.89 |
* |
| PVA fiber |
0.12 |
2 |
0.06 |
0.25 |
- |
| Water-binder ratio |
3.06 |
2 |
1.53 |
6.58 |
* |
| Intra-group errors |
1.86 |
8 |
0.23 |
- |
- |
| Sum |
11.87 |
17 |
3.19 |
- |
- |
Note: “*” represents a significant effect of this factor on the results.
Table 8. Variance analysis results of thermal conductivity. Source: Dai, J., et al., 2022
| Factors |
Thermal Conductivity |
| SS |
Df |
MS |
F |
Significance |
| GHB |
0.09510 |
5 |
0.01902 |
9.76039 |
** |
| PVA fiber |
0.00510 |
2 |
0.00255 |
1.30973 |
- |
| Water-binder ratio |
0.00148 |
2 |
0.00074 |
0.37972 |
- |
| Intra-group errors |
0.01559 |
8 |
0.00195 |
- |
- |
| Sum |
0.11727 |
17 |
0.02426 |
- |
- |
Note: “**” represents a high significant effect of this factor on the results.
As can be seen, the results are consistent with range analysis. Although the addition of GHB can improve the thermal insulation performance of GPCC, a large amount of GHB will reduce the strength of the material. The strength and thermal conductivity of GPCC, particularly the split tensile strength, were unaffected by the fiber content.
The comprehensive balance method was used to determine the impact of various factors on the GPCC performance indexes and ultimately determine the optimum proportion.
Discontinuities and micro-cracks are common weak points in traditional concrete. PVA fibers could be used as a bonding base for cement, as well as a joining material to connect discontinuous areas and decrease discontinuities and microcracks within the concrete. The microstructure of PVA fiber-reinforced concrete does have a three-dimensional mesh distribution of fibers within the matrix, as shown in Figure 7.
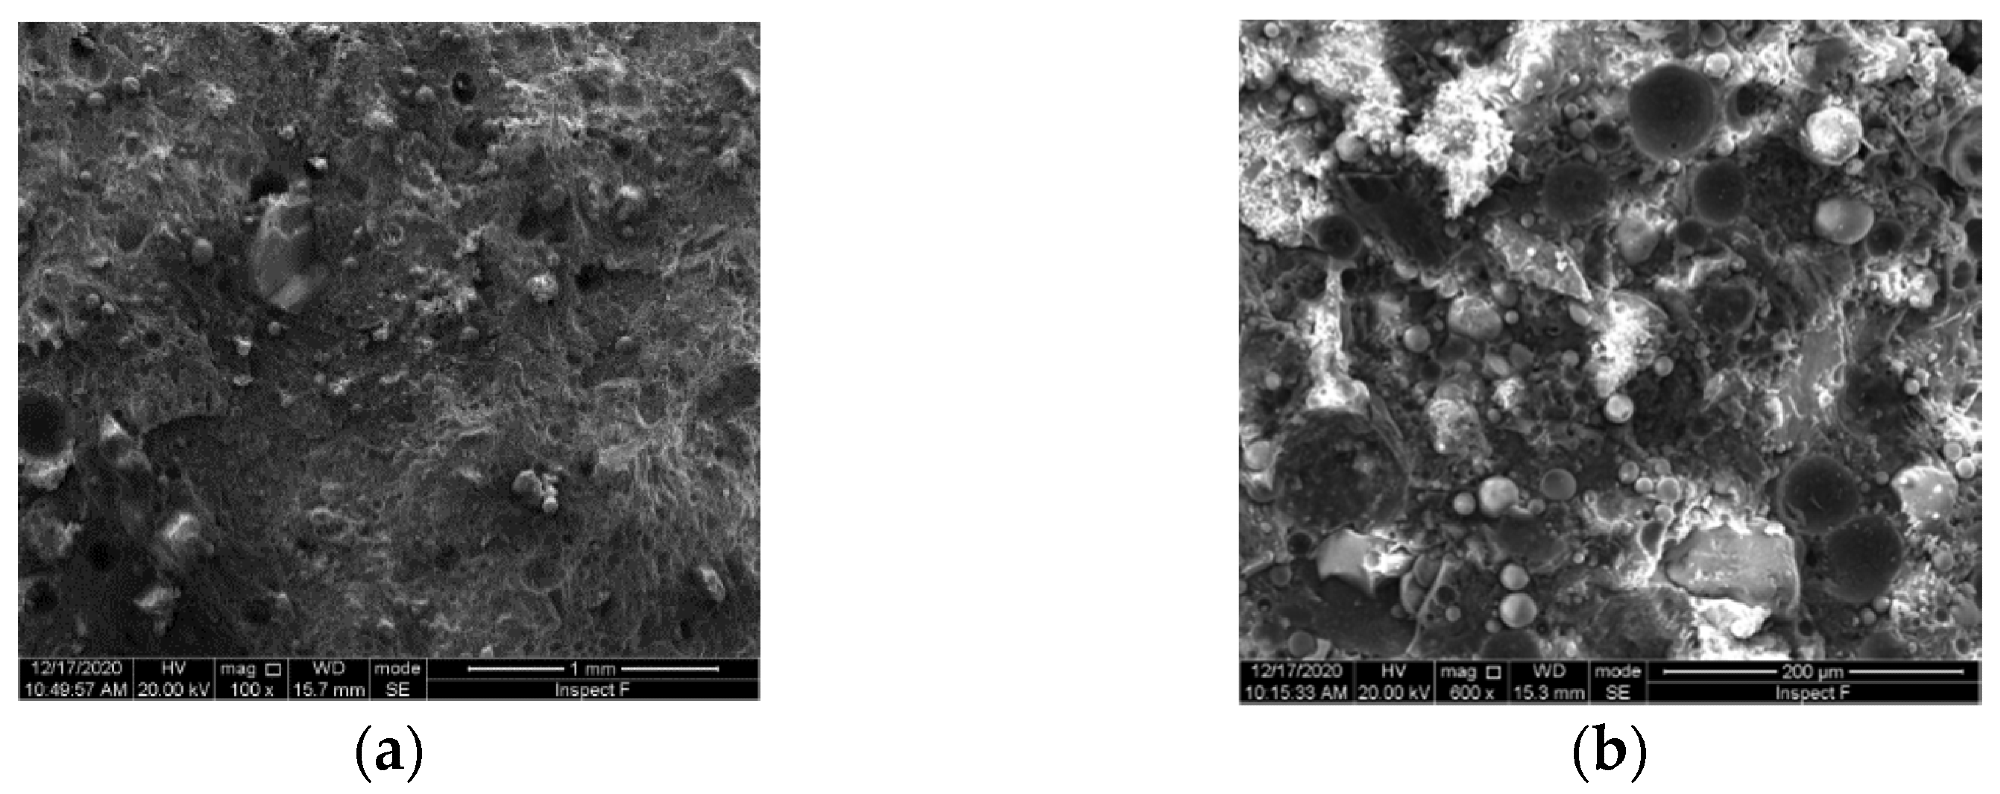
Figure 7. Micro-structure of GHB concrete and plain concrete: (a) GHB concrete; (b) plain concrete. Image Credit: Dai, J., et al., 2022
The morphological structure of GPCC after compressive damage was recognized by SEM electron microscopy in the zone around the crack of the GPCC compressive specimen, as shown in Figure 8.
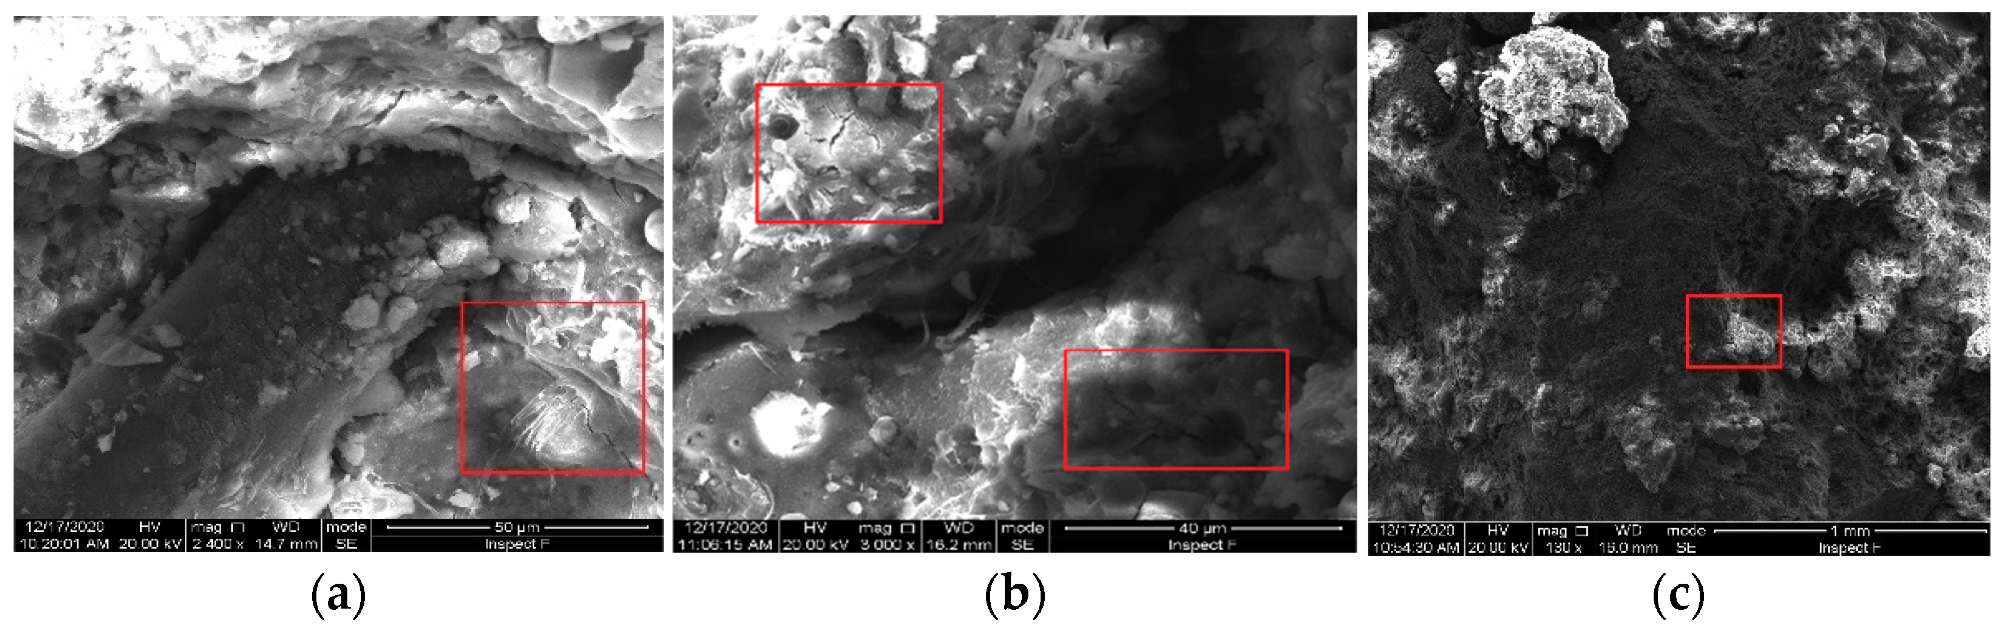
Figure 8. Micro-structure of GPCC: (a) fiber/matrix interface; (b) cement matrix near GHB; (c) GHB/matrix interface. Image Credit: Dai, J., et al., 2022
Conclusion
The impact of GHB content on compressive and split tensile strengths, as well as thermal conductivity, is important; however, the impact of water–cement ratio on split tensile strength is even more significant. The amount of PVA in GPCC has little impact on its strength and thermal conductivity.
When the content of GHB is higher than 40%, there is a significant decrease in strength, and the effect of fiber is not visible in this experiment. It is possible that the high doses of GHB will interact with the PVA fiber, and this issue should be addressed in future research. The results of this study can be used as a guideline for using GHB and PVA fiber in an insulated-bearing material.
Journal Reference
Dai, J., et al. (2022) Influence of Glazed Hollow Bead on the Performance of Polyvinyl Alcohol Fiber Reinforced Cement Composites. Crystals, 12(4), p. 454. Available Online: https://www.mdpi.com/2073-4352/12/4/454/htm
References and Further Reading
- Lee, J., et al. (2017) Development of thermal enhanced n-octadecane/porous nano carbon-based materials using 3-step filtered vacuum impregnation method. Thermochimica Acta, 655, pp. 194–201. doi.org/10.1016/j.tca.2017.06.013.
- Lachheb, M., et al. (2017) Thermal behavior of a hybrid PCM/plaster: A numerical and experimental investigation. Applied Thermal Engineering, 111, pp. 49–59. doi.org/10.1016/j.applthermaleng.2016.09.083.
- Dean, B., et al. (2016) Towards Zero-Emission Efficient and Resilient Buildings; Global Status Report; Global Alliance for Buildings and Construction (GABC): Paris, France.
- Ari, I & Sari, R (2017) Differentiation of developed and developing countries for the Paris Agreement. Energy Strategy Reviews, 18, pp. 175–182. doi.org/10.1016/j.esr.2017.09.016.
- Aghniaey, S & Lawrence, T M (2018) The impact of increased cooling setpoint temperature during demand response events on occupant thermal comfort in commercial buildings: A review. Energy and Buildings, 173, pp. 19–27. doi.org/10.1016/j.enbuild.2018.04.068.
- Xu, X., et al. (2018) A review on temperature and humidity control methods focusing on air-conditioning equipment and control algorithms applied in small-to-medium-sized buildings. Energy and Buildings, 162, pp. 163–176. doi.org/10.1016/j.enbuild.2017.12.038.
- Yao, W & Pang, J (2019) Performance degradation and microscopic structure of glazed hollow bead insulation normal concrete after exposure to high temperature. Acta Materiae Compositae Sinica, 36, pp. 2932–2941. https://fhclxb.buaa.edu.cn/en/article/doi/10.13801/j.cnki.fhclxb.20190118.001.
- Zhang, Y., et al. (2015) Mix design for thermal insulation concrete using waste coal gangue as aggregate. Materials Research Innovations, 19, pp. S5–S878. doi.org/10.1179/1432891714Z.0000000001212.
- Zhao, L., et al. (2015) An experimental study to evaluate the effects of adding glazed hollow beads on the mechanical properties and thermal conductivity of concrete. Materials Research Innovations, 19, pp. S5–S929. doi.org/10.1179/1432891714Z.0000000001224.
- Liu, J., et al. (2017) Effect of reinforcement ratio on seismic performance of thermal insulation concrete shear wall with glazed hollow bead. Engineering Journal of Wuhan University, 50, pp. 269–273.
- Feng, W (2015) Study on Flexural Behavior of Glazed Hollow Bead Insulation Concrete Beams. Master’s Thesis, Taiyuan University of Technology, Taiyuan, China.
- Zhu, B & Han, L (2018) Aseismic structure design of glazed hollow bead insulation concrete shear wall. China Earthquake Engineering Journal, 40, pp. 963–968.
- Chang, J (2015) Research on Thermal Performance of Thermal Insulation Glazed Hollow Bead Concrete Hollow Shear Walls. Master’s Thesis, Taiyuan University of Technology, Taiyuan, China.
- Wu, D (2013) Bearing Capacity of Glazed Hollow Bead Insulation Concrete Beams and Columns after Exposure to Elevated Temperatures. Master’s Thesis, Taiyuan University of Technology, Taiyuan, China.
- Wu, H (2017) Vitrified Microsphere, the Performance Analysis of External Thermal Insulation Walls. Master’s Thesis, Hunan University of Science and Technology, Xiangtan City, China.
- Zhu, J & Li, G (2015) Performance of thermal insulation materials of polypropylene fiber reinforced vitrified small ball. Journal of Building Materials, 18, pp. 658–662. doi.org/10.3303/CET1762056
- Wu, W.J & Yu, Y M (2014) Study on proportioning of vitrified beads insulation mortar based on single factor analysis. Master Rep, 28, pp. 385–390.
- Lim, Y & Li, V C (1997) Durable repair of aged infrastructures using trapping mechanism of engineered cementitious composites. Cement and Concrete Composites, 19, pp. 373–385. doi.org/10.1016/S0958-9465(97)00026-7.
- Parra-Montesinos, G & Wight, J K (2000) Seismic response of exterior RC column-to-steel beam connections. Journal of Structural Engineering, 126, pp. 1113–1121. doi.org/10.1061/(ASCE)0733-9445(2000)126:10(1113)
- Li, V. C., et al. (2002) Interface tailoring for strain-hardening polyvinyl alcohol-engineered cementitious composite (PVA-ECC). Journal of Materials Science, 99, pp. 463–472.
- Shao, Y & Shah, S P (1997) Mechanical properties of PVA fiber reinforced cement composites fabricated by extrusion processing. Journal of Materials Science, 94, pp. 555–564.
- Li, V. C., et al. (2001) Tensile strain-hardening behavior of polyvinyl alcohol engineered cementitious composite (PVA-ECC). Journal of Materials Science, 98, pp. 483–492.
- Lye, H. L., et al. (2020) Bond behaviour of CFRP-strengthened ECC using Response Surface Methodology (RSM). Case Studies in Construction Materials, 12, p. e327. doi.org/10.1016/j.cscm.2019.e00327.
- Al-Fakih, A., et al. (2021) On rubberized engineered cementitious composites (R-ECC): A review of the constituent material. Case Studies in Construction Materials, 14, p. e536. doi.org/10.1016/j.cscm.2021.e00536
- Research of the Properties of Polyvinyl Alcohol Fiber Concrete. (2018) Master’s Thesis, Yangzhou University, Yangzhou, China.
- Meng, Q., et al. (2017) Performance analysis of polypropylene fiber mortar in vitrified microspheres. Energy efficient buildings, 45, pp. 45–46.
- Feng, T., et al. (2021) Investigation and Preparation of the Plastering Mortar for Autoclaved Aerated Blocks Walls. Crystals, 11, p. 175. doi.org/10.3390/cryst11020175.
- Fan, S., et al. (2017) Drying shrinkage and cracking behavior of polypropylene fiber reinforced glazed hollow beads thermal insulation mortar. Journal of Building Materials, 20, pp. 118–123.
- Xu, J., et al. (2014) Test research of steel fiber insulation concrete compressive performance. Concrete, 11, pp. 93–95.
- Wang, C (2019) Effect of Polyvinyl Alcohol Fiber and Vitrified Micro Bead On Properties of Foam Concrete. Master’s Thesis, Inner Mongolia University of Science and Technology, Baotou, Inner Mongolia, China.
- GB/T 50081; Standard for Test Method of Mechanical Properties on Ordinary Concrete. (2019) Beijing Standards Press of China: Beijing, China.
- GB/10295; Standard for Thermal Insulation(2008)—Determination of Steady-State Thermal Resistance and Related Properties—Heat Flow Meter Apparatus. Beijing Standards Press of China: Beijing, China.