Jun 23 2022
The most intuitive spatial aspect of urbanization is that man-made space replaces natural space, resulting in an urban heat island that threatens human thermal comfort, health, and energy usage. Several investigations have examined the impact of urban vegetation coverage on the thermal environment, but the issue of how that impact will affect urban energy consumption needs has been overlooked. This has been explored in the journal Buildings.
Study: Study on the Effect of Vegetation Coverage on Urban Cooling and Energy Conservation: A Case Study of a Typical Hilly City, Chenzhou, China. Image Credit: Teo Tarras/Shutterstock.com
Currently, research on the impact of urban vegetation coverage on the thermal environment is mostly carried out through three methods. To begin, field measurement is often employed. Second, remote sensing is employed to investigate the thermal effects of large-scale greening. The simulation method is utilized as the third method to evaluate the effects of greening on the micro-scale thermal environment.
Although numerous researchers have looked at the impact of urban greening on the thermal environment, only a few have looked at the impact of greening on conserving energy at the micro-scale. Unfortunately, no research has been done on the impact of general urban vegetation covering on overall city energy savings, which is the novelty of this work.
Methodology
The connection between vegetation coverage and energy conservation was investigated in four steps. The impact of vegetation cover on land surface temperature was first discovered. The research collected the relevant information on vegetation coverage and land surface temperature using the remote sensing inversion method, which was then evaluated using correlation and regression techniques.
Secondly, the literature on temperature and energy usage was studied, and the relationship between the two was established. Finally, using the three stages outlined above, this article calculated the impact of vegetation covering on urban energy conservation. Figure 1 depicts the abstract image of this investigation.
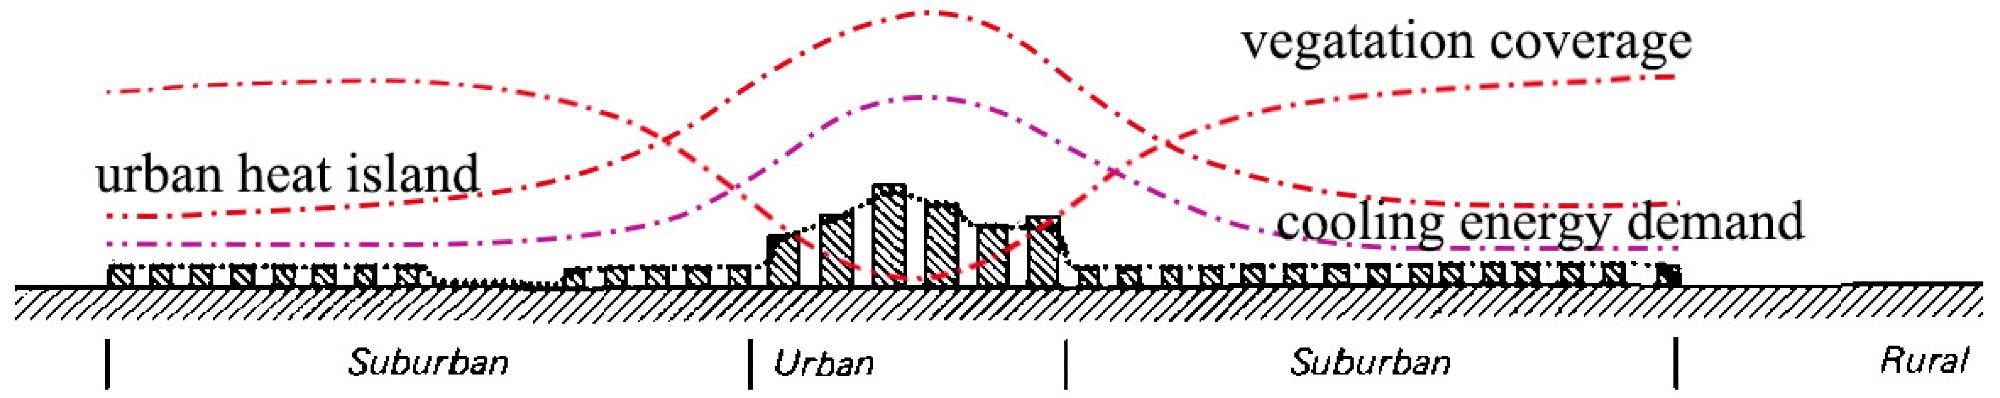
Figure 1. Abstract picture of the study. Image Credit: Luo, et al., 2022
This report estimated the atmospheric correction parameter, as shown in Figure 2, using the NASA official website.
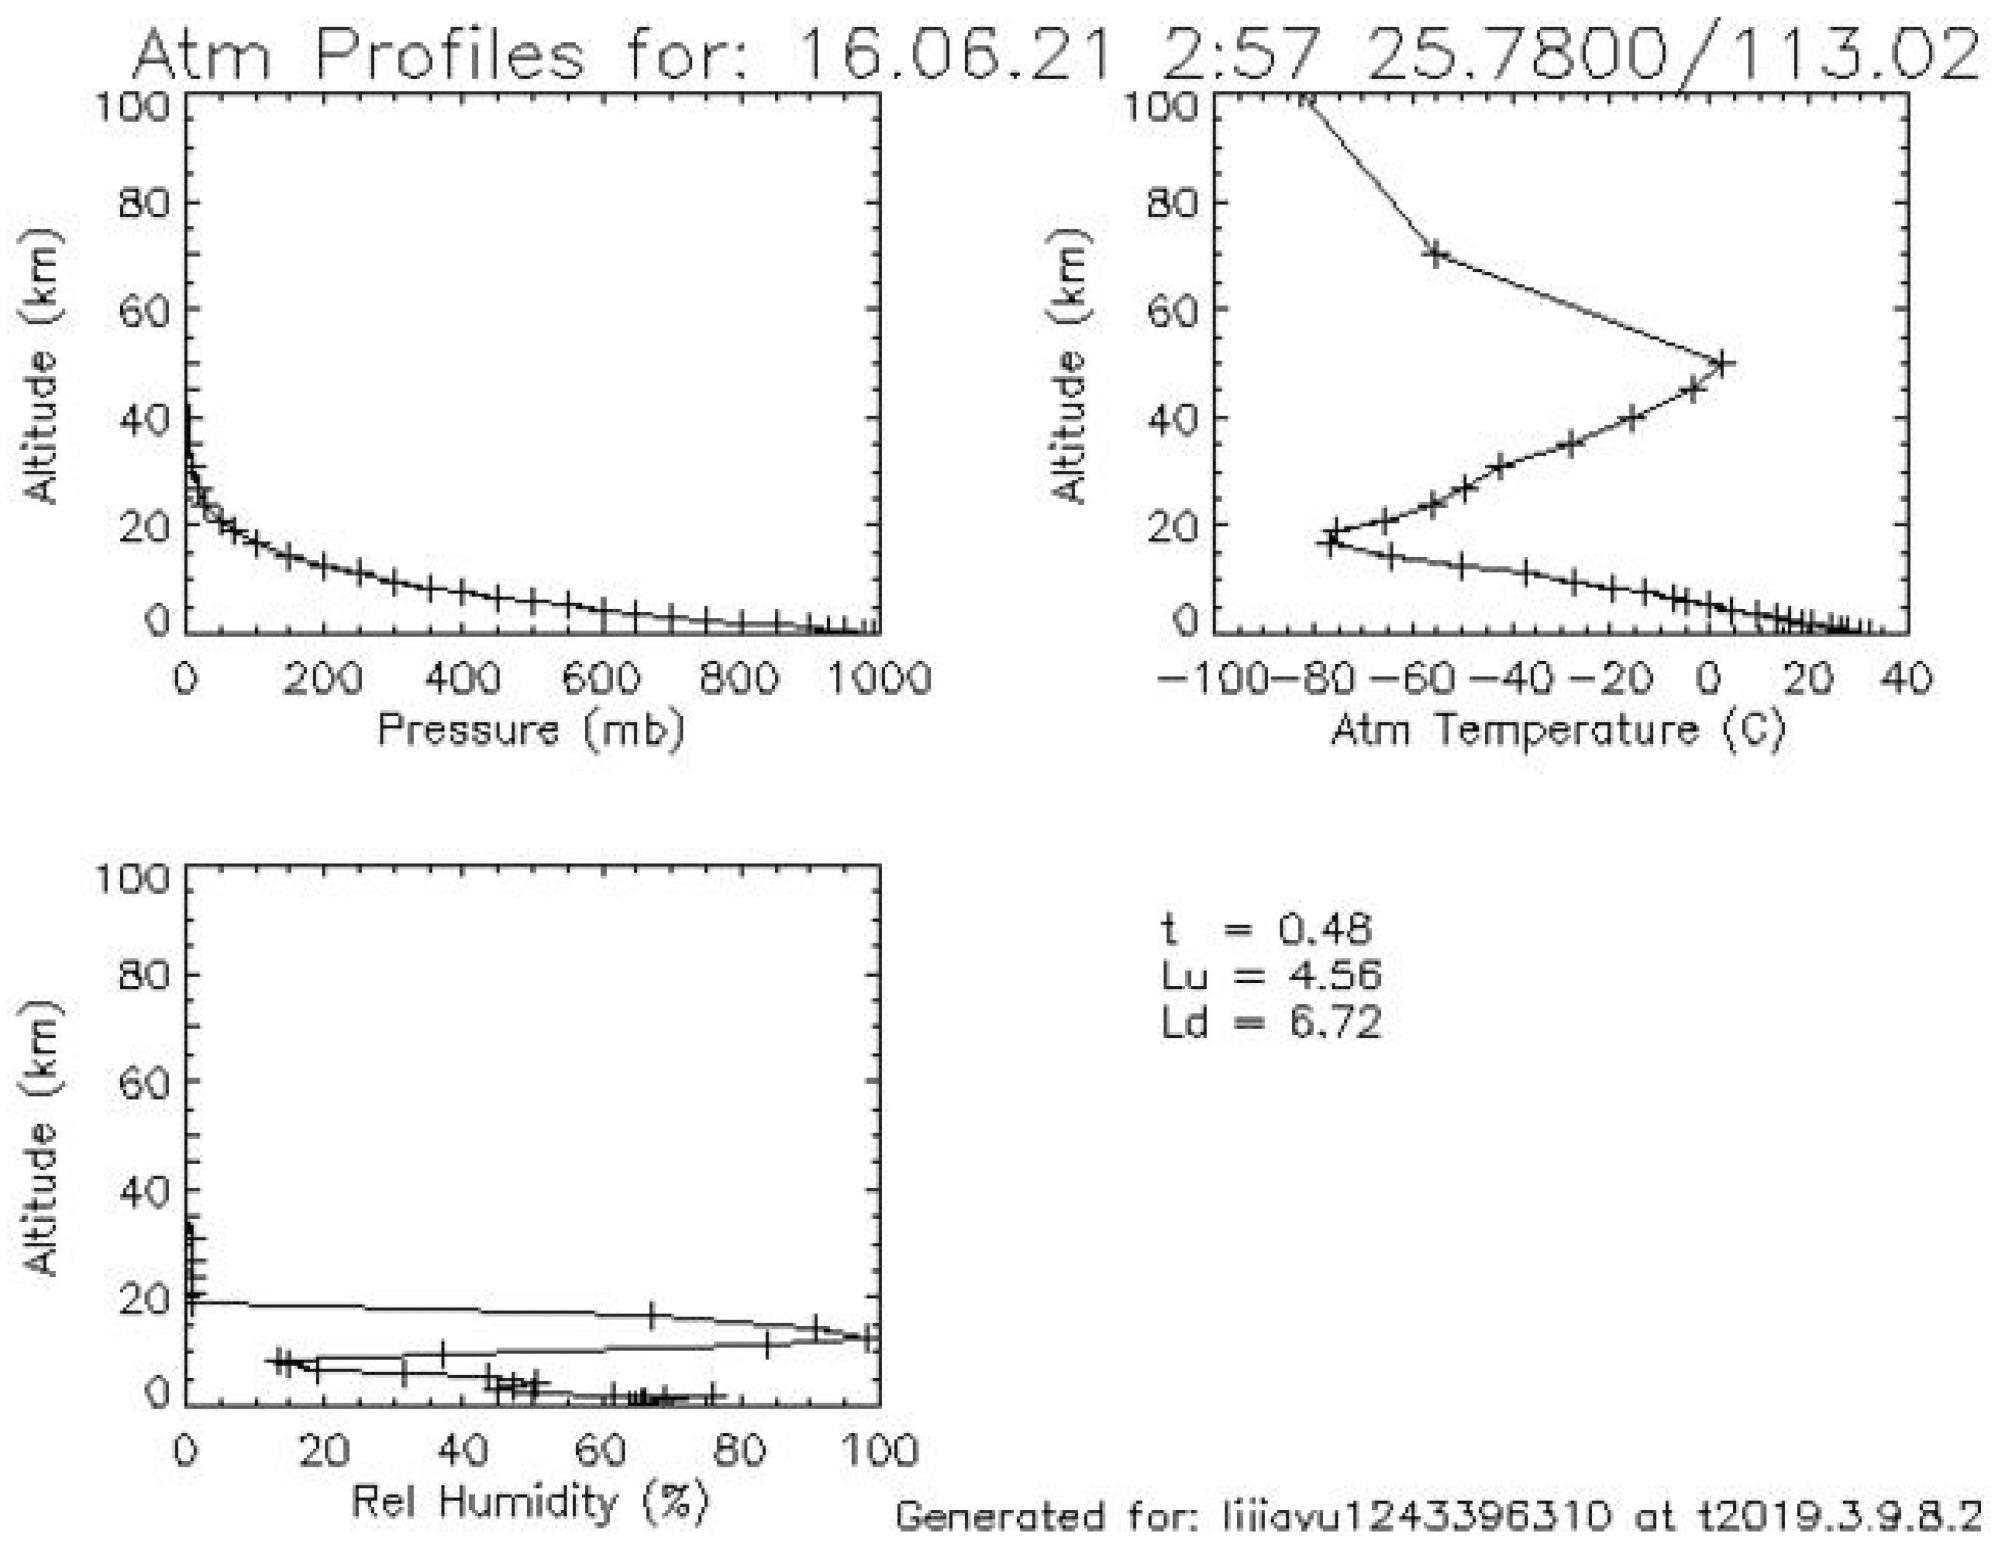
Figure 2. Atmospheric correction parameter calculation. Image Credit: Luo, et al., 2022
Discussion
Chenzhou was chosen as the study location since it is a typical hilly city with a diverse vegetation cover. Chenzhou is split into 26 districts, and Figure 3 depicts the layout of these.
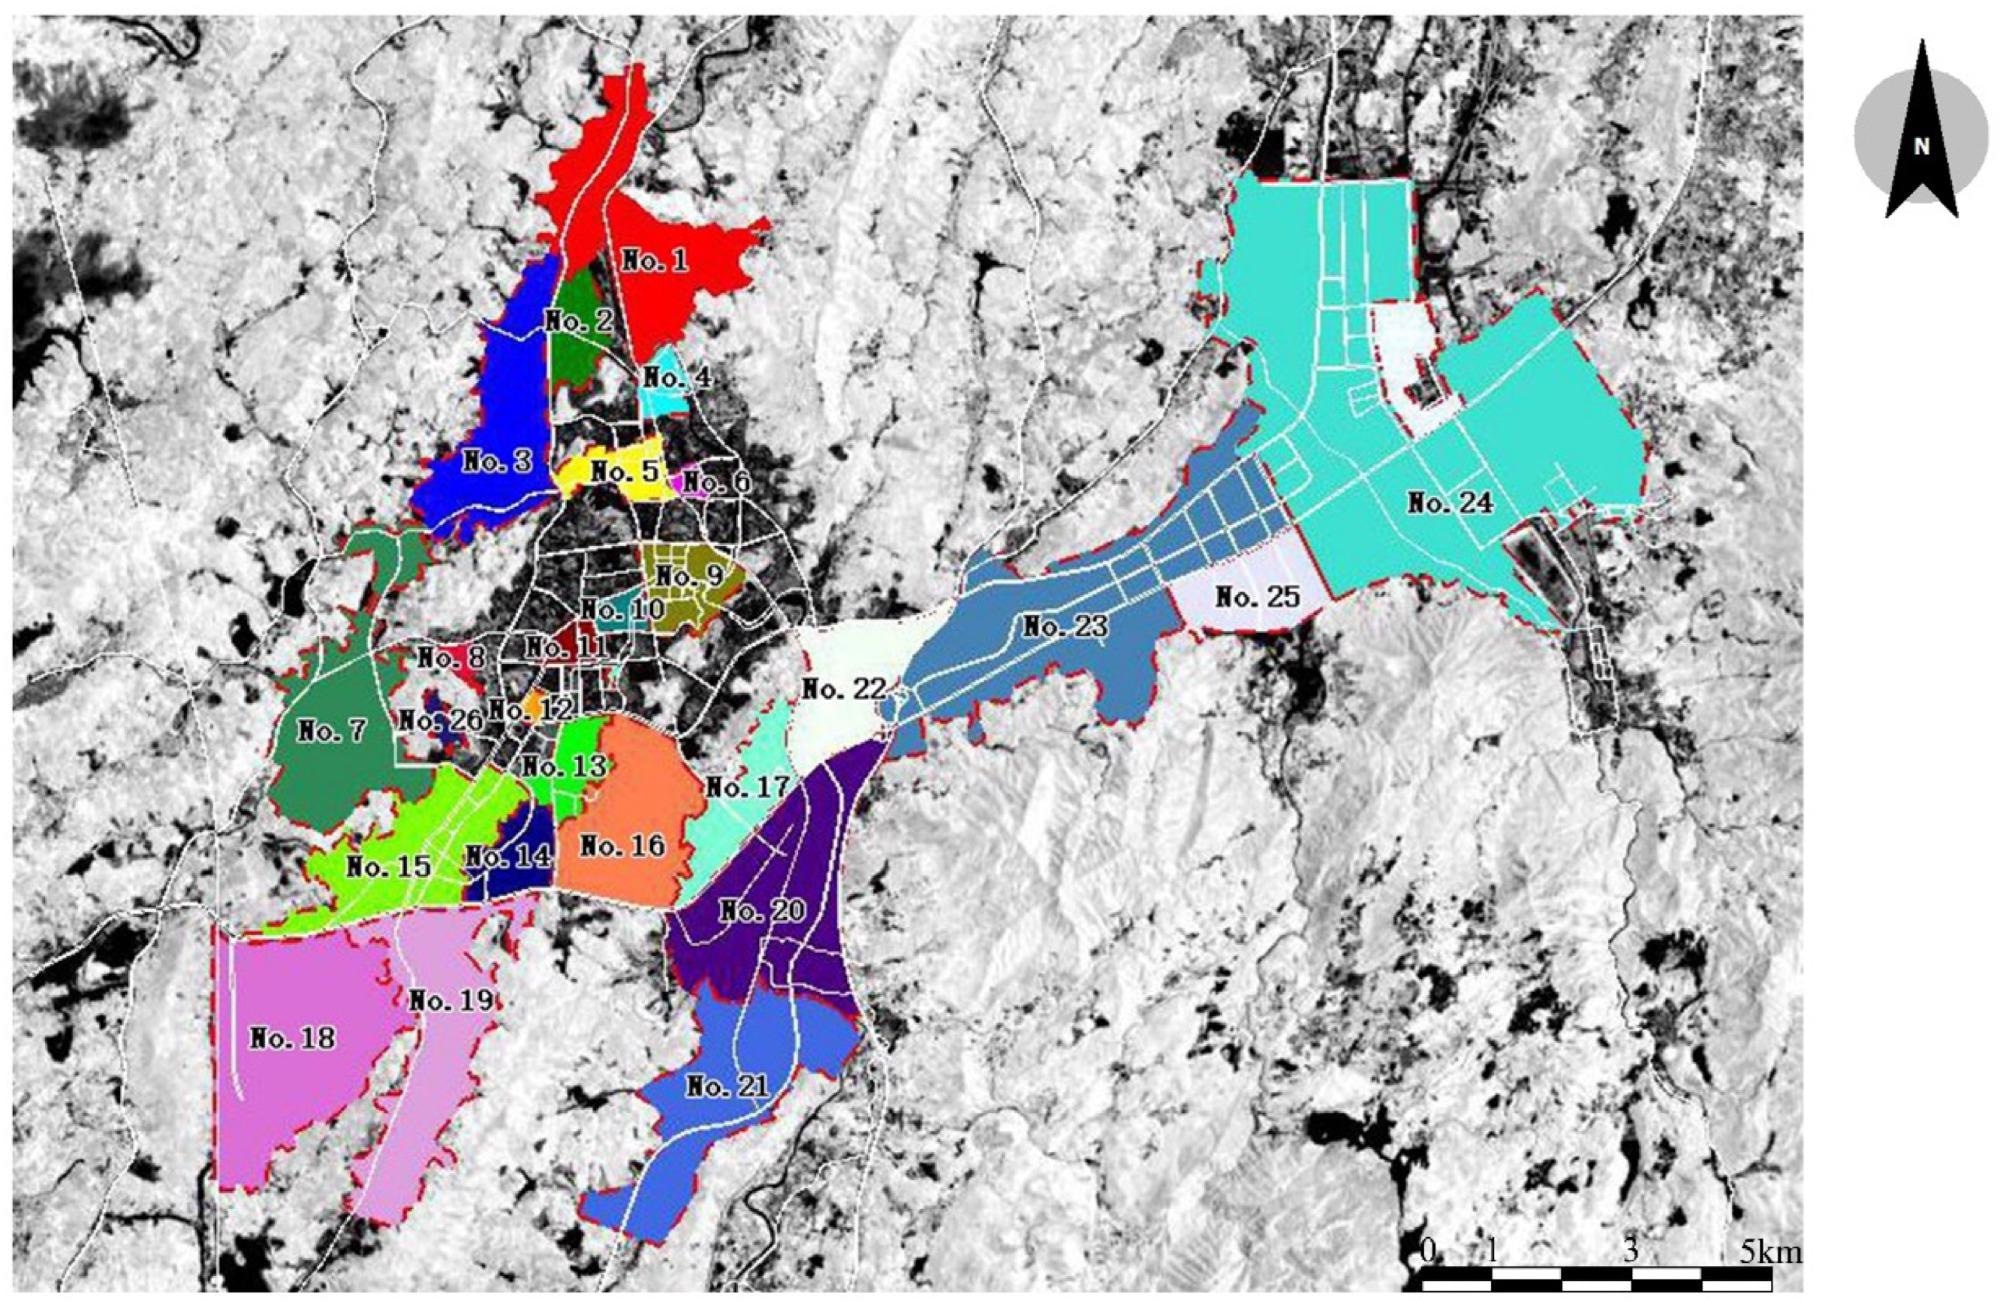
Figure 3. The 26 areas with urbanization characteristics. Image Credit: Luo, et al., 2022
The vegetation coverage of 26 regulatory proper planning districts in Chenzhou was extracted independently using Envi software, as shown in Figure 4, where the legend represents the vegetation coverage value between 0 and 1.
Figure 5 depicts the average surface temperatures of the 26 districts, with the legend indicating the land surface temperature value between 0 and 1.
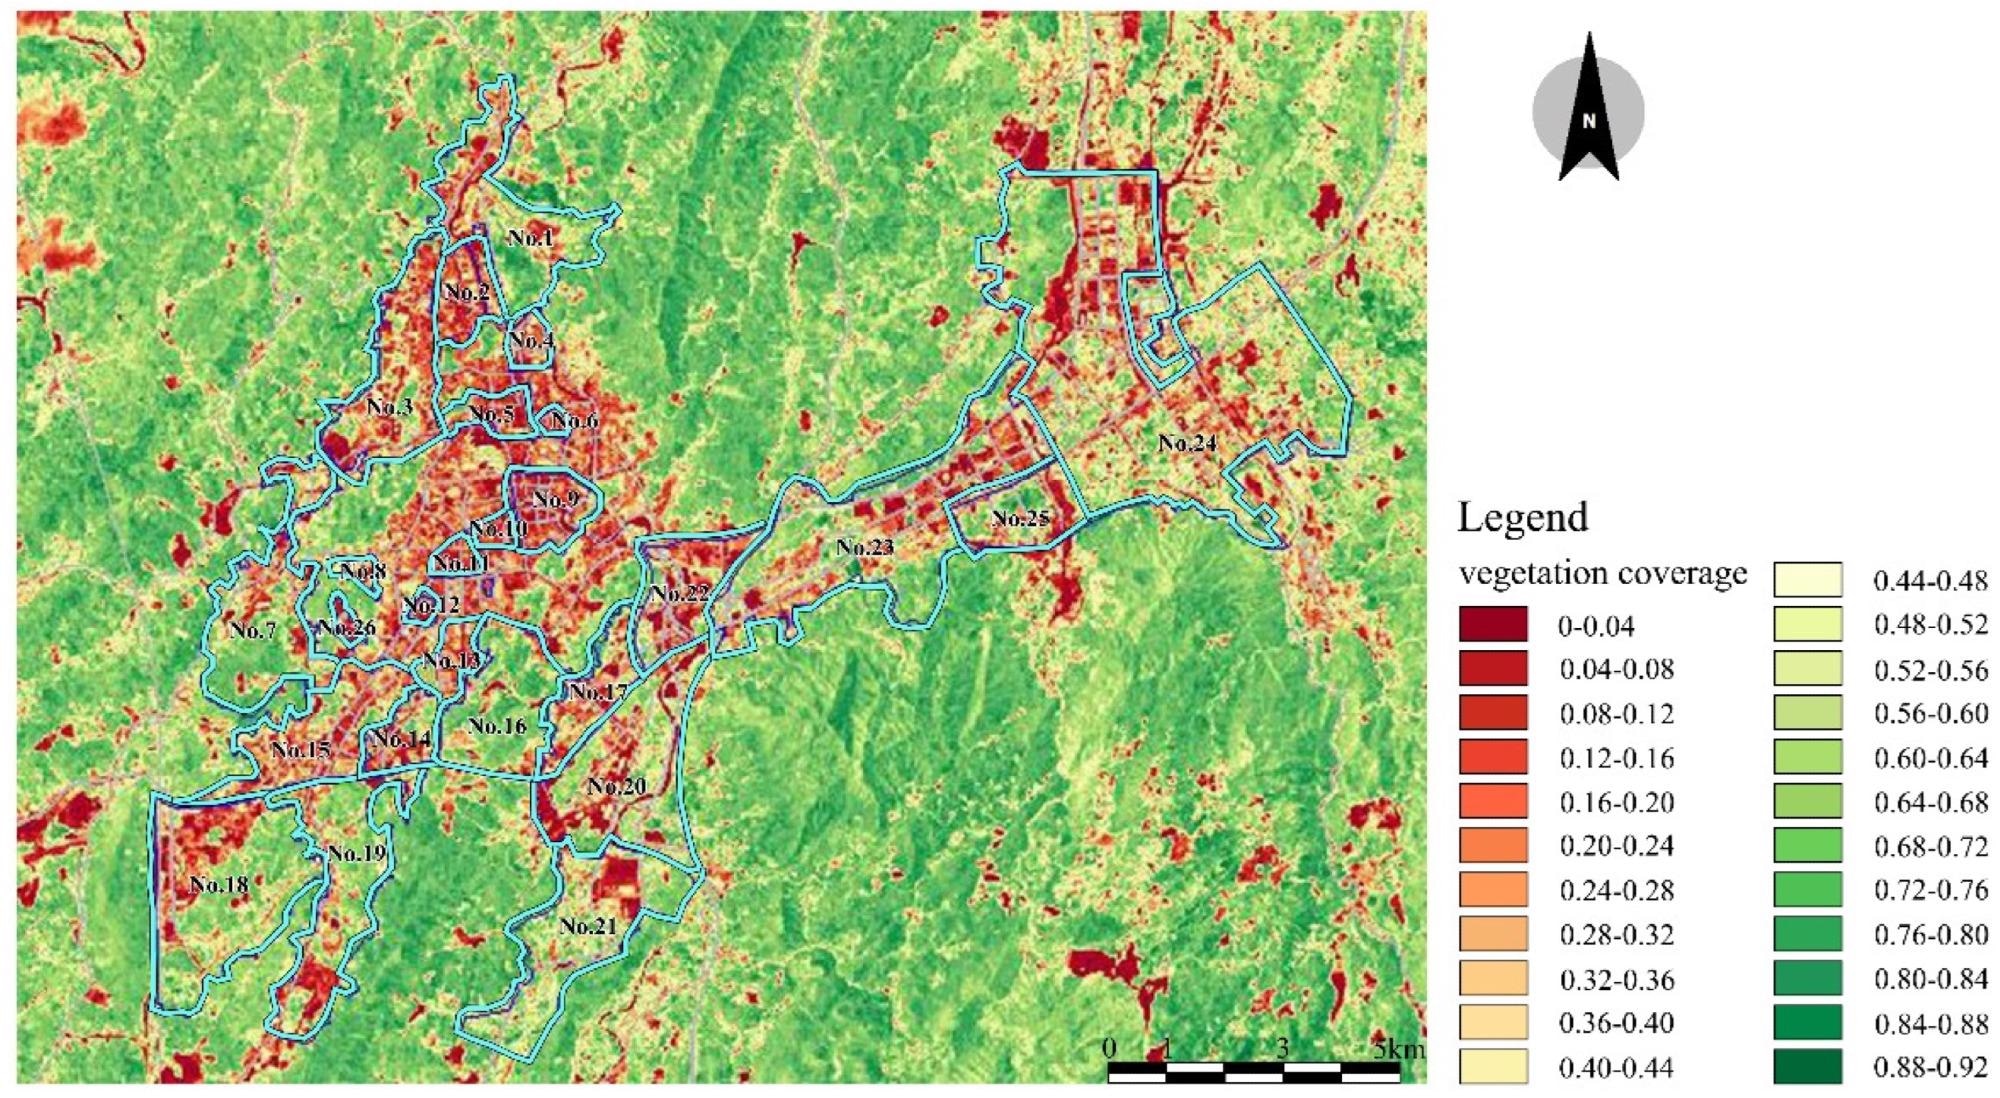
Figure 4. Overall map of vegetation coverage in 26 areas. Image Credit: Luo, et al., 2022
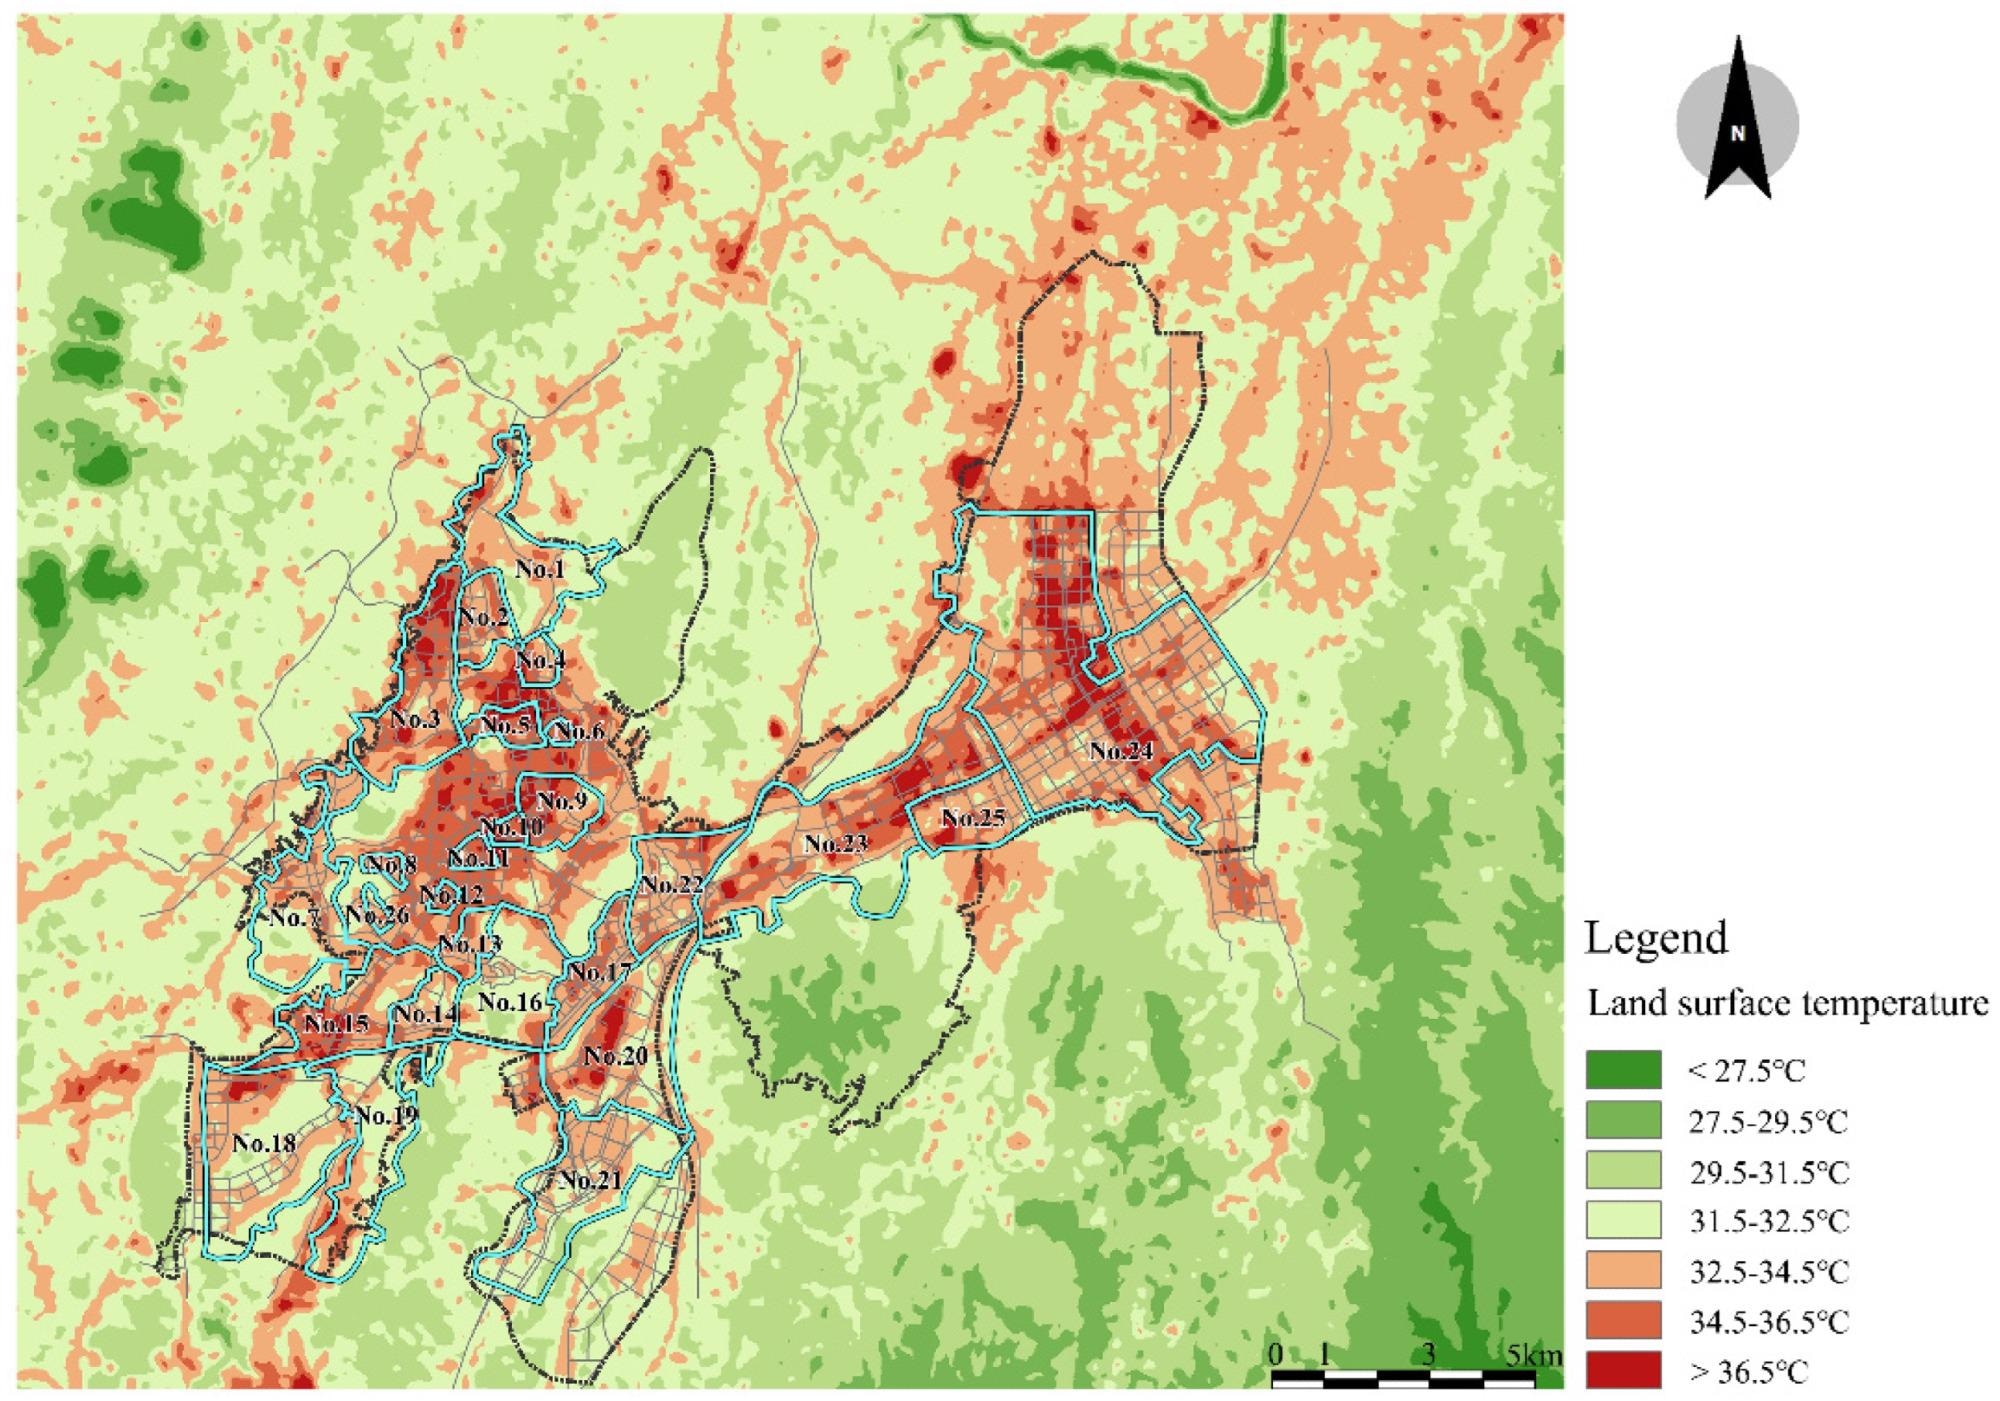
Figure 5. Overall map of land surface temperatures in 26 areas. Image Credit: Luo, et al., 2022
Table 1 shows the overall land surface temperature (ST) and vegetation coverage (VC) of the 26 districts.
Table 1. Statistical table of mean temperature and vegetation coverage. Source: Luo, et al., 2022
| No |
ST (°C) |
VC |
No |
ST (°C) |
VC |
No |
ST (°C) |
VC |
| 1 |
32.2273 |
0.4463 |
10 |
36.3274 |
0.1396 |
19 |
32.5020 |
0.4506 |
| 2 |
34.8395 |
0.1774 |
11 |
35.3807 |
0.1281 |
20 |
33.0571 |
0.3688 |
| 3 |
34.7336 |
0.2951 |
12 |
35.0846 |
0.1284 |
21 |
31.5379 |
0.4849 |
| 4 |
34.6917 |
0.1893 |
13 |
33.9371 |
0.2618 |
22 |
33.6529 |
0.2697 |
| 5 |
35.5906 |
0.1842 |
14 |
33.2060 |
0.3292 |
23 |
33.8655 |
0.3906 |
| 6 |
35.7338 |
0.1306 |
15 |
34.1990 |
0.3018 |
24 |
33.8203 |
0.4010 |
| 7 |
32.1797 |
0.4612 |
16 |
31.3097 |
0.5457 |
25 |
34.0082 |
0.3836 |
| 8 |
33.3703 |
0.2960 |
17 |
33.8162 |
0.3398 |
26 |
33.0308 |
0.2034 |
| 9 |
35.4977 |
0.1600 |
18 |
32.0618 |
0.4616 |
|
|
|
The Pearson correlation approach was then used to examine the relationship between surface temperature and vegetation coverage in these 26 districts to see if there was an intrinsic relationship.
Table 2 shows the findings of the Pearson correlation analysis.
Table 2. Descriptive statistics and correlations. Source: Luo, et al., 2022
| Descriptive Statistics |
| |
Mean |
Std. Deviation |
N |
| Vegetation coverage |
0.30495881 |
0.127784197 |
26 |
| Temperature |
33.83313469 |
1.358457073 |
26 |
| Correlations |
| |
|
Vegetation coverage |
Temperature |
| Vegetation coverage |
Pearson Correlation |
1 |
-0.892 |
| Sig.(2-tailed) |
|
0 |
| N |
26 |
26 |
| Temperature |
Pearson Correlation |
-0.892 |
1 |
| Sig.(2-tailed) |
0 |
|
| N |
26 |
26 |
Understanding the influence of vegetation coverage on surface temperature is crucial to further investigating the effects of vegetation coverage on energy consumption.
As a result, these 26 groups of information were subjected to linear model regression analysis, quadratic model regression analysis, compound model regression analysis, logarithmic model regression analysis, cubic function model regression analysis, S model regression analysis, inverse model regression analysis, power model regression analysis, exponential distribution model regression analysis, and growth model regression analysis.
Figure 6 depicts the outcomes of their research.
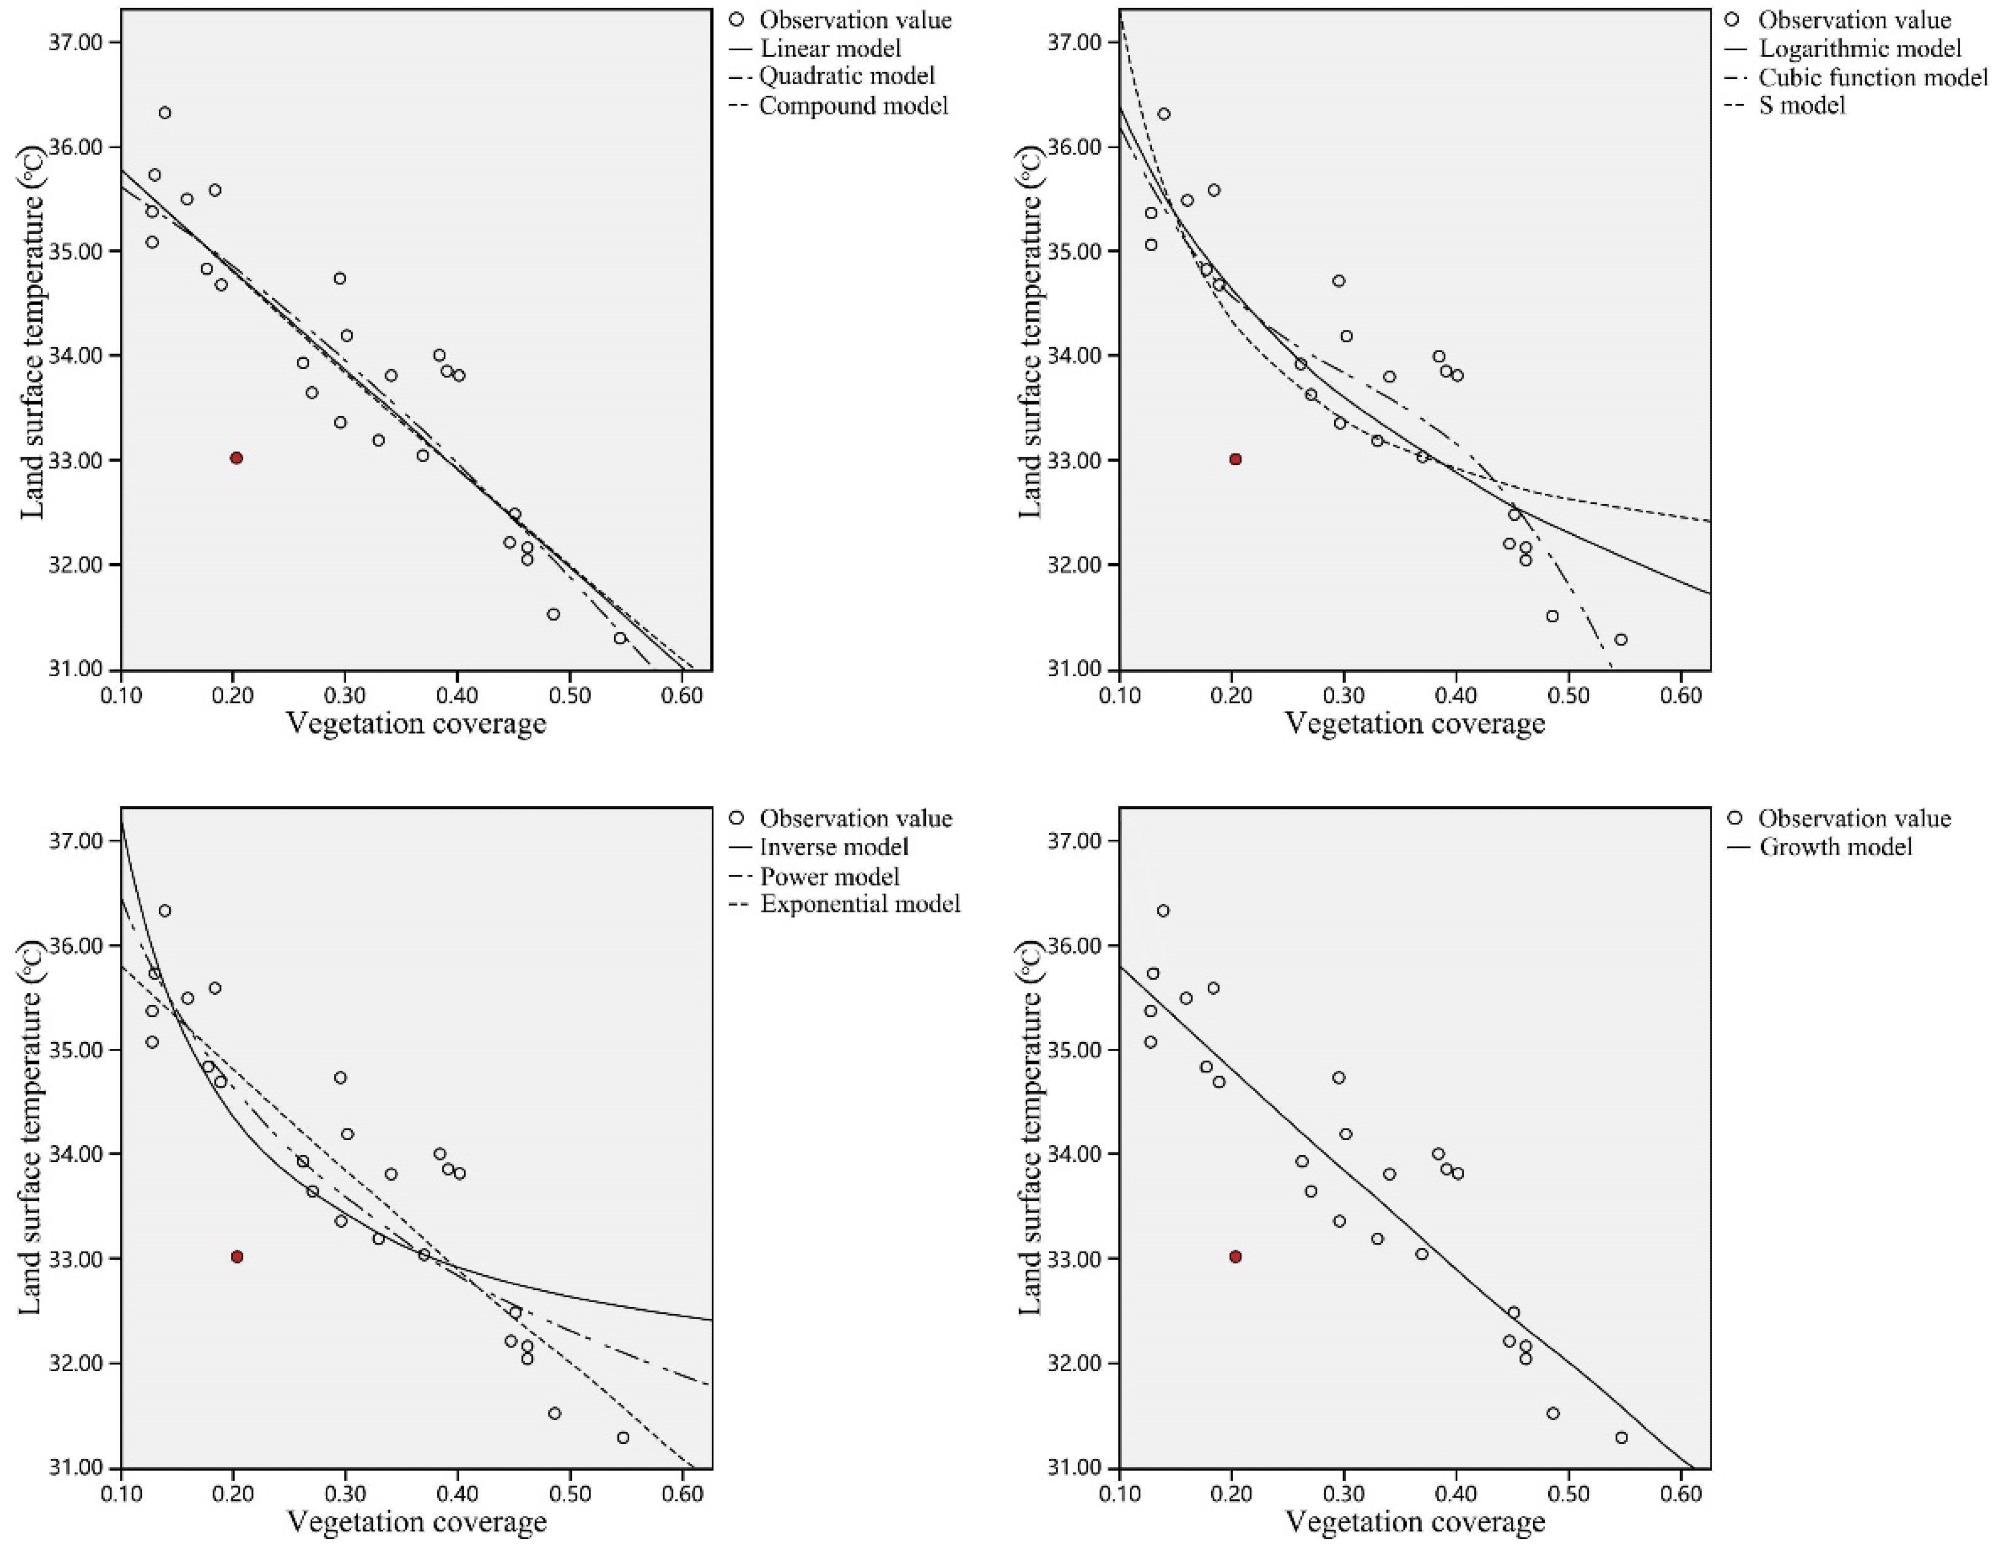
Figure 6. Fitting and optimum selection of regression function. Image Credit: Luo, et al., 2022
In Figure 6, both the inverse model and the S function model fit the point distribution well. When examining the connection between density and urban functions in urban planning, it is only permitted in urban industrial districts when the vegetation density is less than 20%, and other functional departments are not permitted.
There is a deviating point in Figure 6 that has been highlighted in red. The deviating point indicates that foliage coverage and surface temperature were both low, contradicting the research findings.
Several statistical types of research, particularly in the energy disciplines, have investigated the effects of temperature on energy usage, with numerous positive outcomes. There are some notable academic findings on the impact of temperature on energy use.
Equation 3 shows the function expression, whereas Figure 7 shows the related function image.
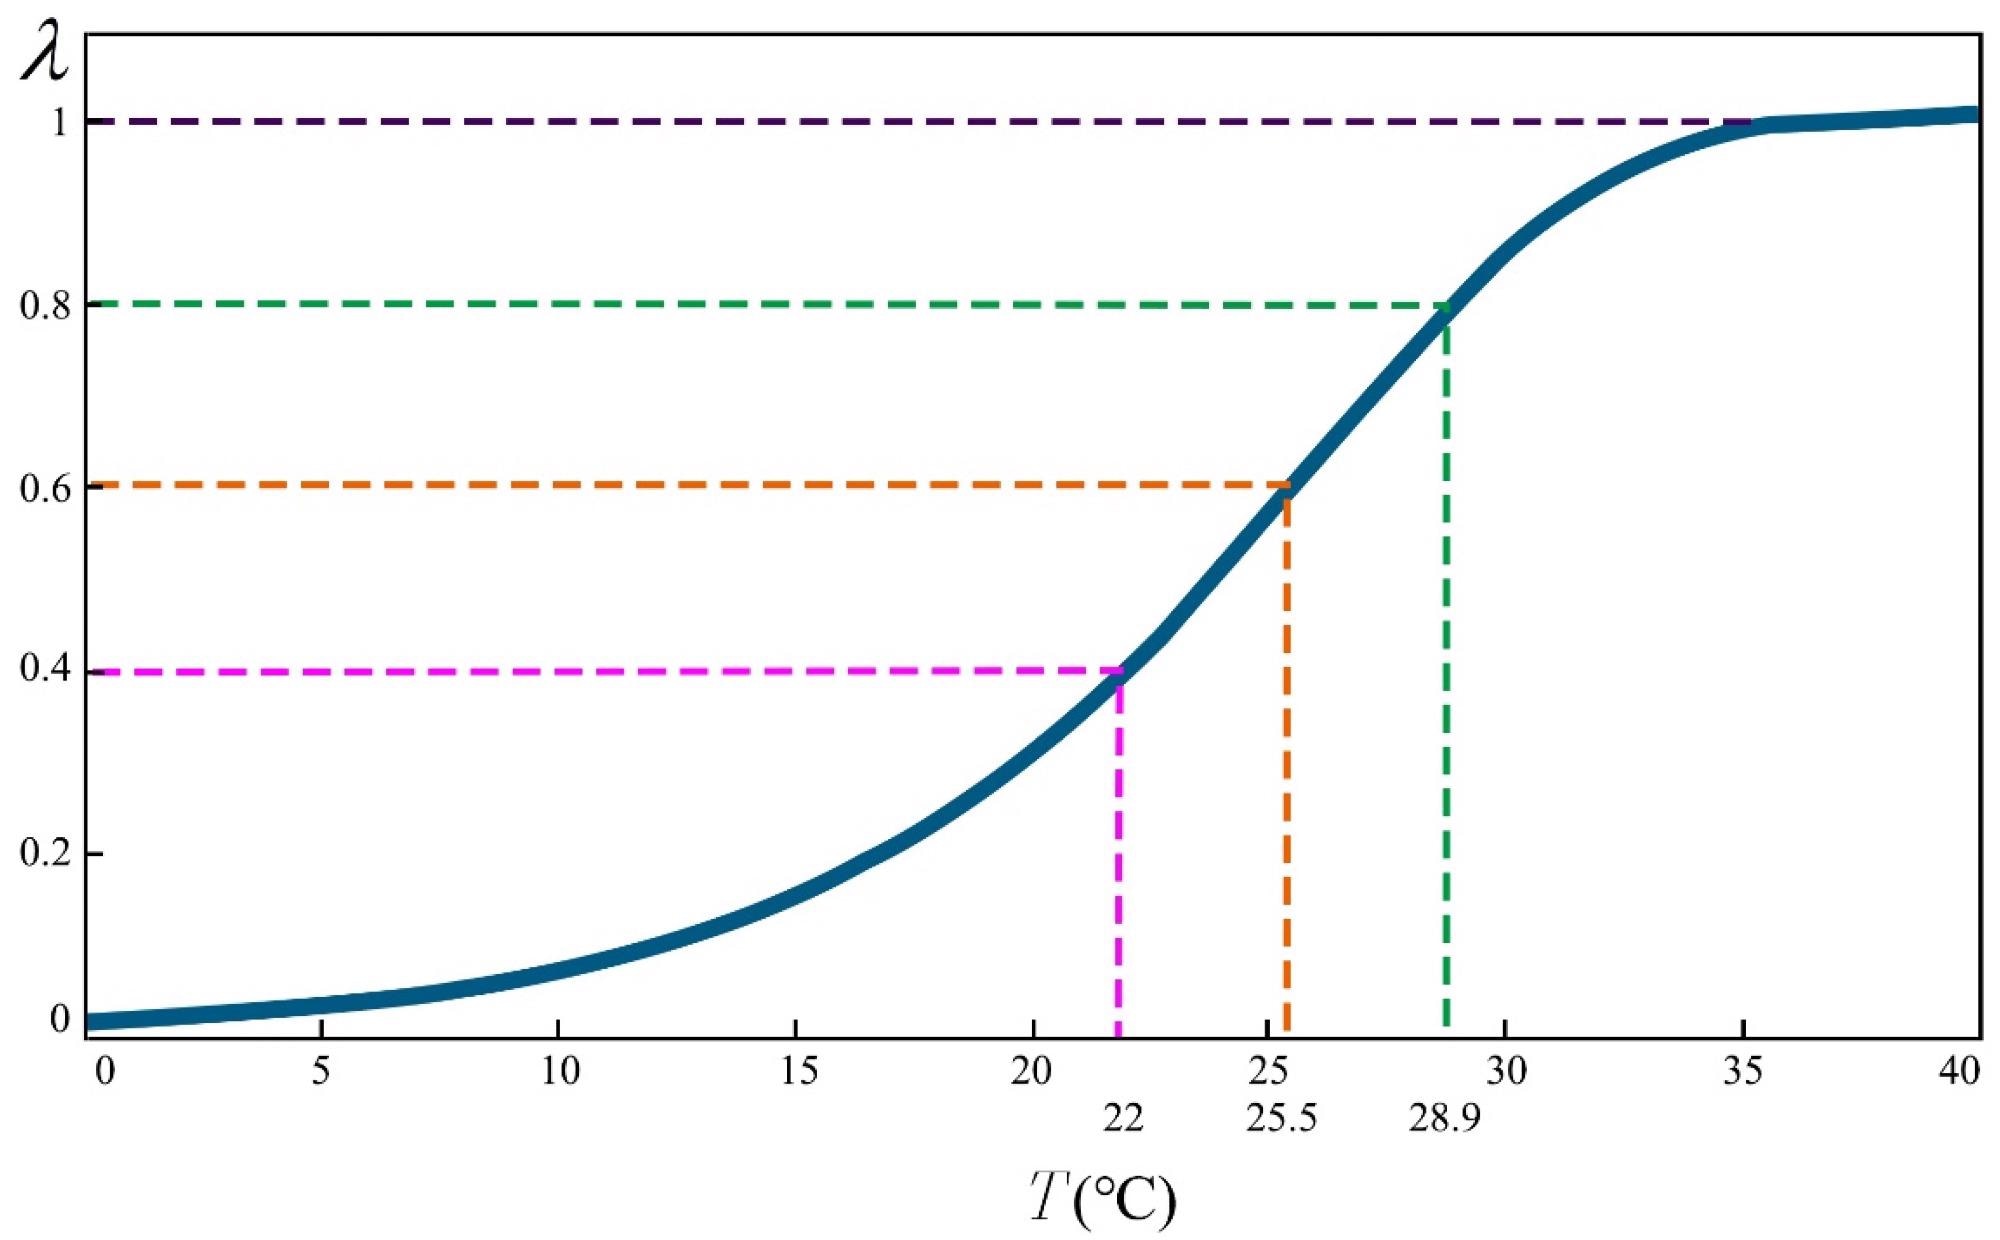
Figure 7. λ and T model image. Image Credit: Luo, et al., 2022
Figure 7 indicates that while the temperature is below 22°C, air conditioning energy usage is unaffected by temperature changes.
Conclusion
The findings of this research can anticipate the city’s entire energy demand based on vegetation coverage, which is important in urban planning. Moreover, some study limitations need to be addressed:
(1) Although the land surface temperature and the air temperature around it have a strong relationship, the temperature in the “λ-T” model is not the land surface temperature, which may diminish the precision of the result. The subject of land surface temperature and air temperature around the land surface will be investigated further.
(2) This research focused on 26 different districts throughout the city. In the follow-up investigation, more samples will be examined to ensure that the conclusions are universal.
Journal Reference:
Luo, X., Wang, J., Li, J. (2022) Study on the Effect of Vegetation Coverage on Urban Cooling and Energy Conservation: A Case Study of a Typical Hilly City, Chenzhou, China. Buildings, 12(5), p. 640. Available Online: https://www.mdpi.com/2075-5309/12/5/640/htm
References and Further Reading
- Balsa-Barreiro, J., et al. (2019) Globalization and the shifting centers of gravity of world’s human dynamics: Implications for sustainability. Journal of Cleaner Production, 239, p. 117923. doi.org/10.1016/j.jclepro.2019.117923.
- Liu, H., et al. (2018) Spatio-temporal evolution of population and urbanization in the countries along the Belt and Road 1950–2050. Journal of Geographical Sciences, 28, pp. 919–936. doi.org/10.1007/s11442-018-1513-x.
- Hu, Y., et al. (2018) A novel evolution tree for analyzing the global energy consumption structure. Energy, 147, pp. 1177–1187. doi.org/10.1016/j.energy.2018.01.093.
- Doygun, H & Alphan, H (2006) Monitoring urbanization of Iskenderun, Turkey, and its negative implications. Environmental Monitoring and Assessment, 114, pp. 145–155. doi.org/10.1007/s10661-006-2524-0.
- Zhang, X., et al. (2022) Linking urbanization and air quality together: A review and a perspective on the future sustainable urban development. Journal of Cleaner Production, 346, p. 130988. doi.org/10.1016/j.jclepro.2022.130988.
- Byomkesh, T., et al. (2012) Urbanization and green space dynamics in Greater Dhaka, Bangladesh. Landscape and Ecological Engineering, 8, pp. 45–58. doi.org/10.1007/s11355-010-0147-7.
- Yu, Z., et al. (2017) Dynamics of hierarchical urban green space patches and implications for management policy. Sensors, 17, p. 1304. doi.org/10.3390/s17061304.
- Kaloustian, N & Diab, Y (2015) Effects of urbanization on the urban heat island in Beirut. Urban Climate, 14, pp. 154–165. doi.org/10.1016/j.uclim.2015.06.004.
- Lai, D., et al. (2019) A review of mitigating strategies to improve the thermal environment and thermal comfort in urban outdoor spaces. Science of the Total Environment, 661, pp. 337–353. doi.org/10.1016/j.scitotenv.2019.01.062.
- Yan, H., et al. (2018) Influence of a large urban park on the local urban thermal environment. Science of the Total Environment, 622, pp. 882–891. doi.org/10.1016/j.scitotenv.2017.11.327.
- Hardin, P J & Jensen, R R (2007) The effect of urban leaf area on summertime urban surface kinetic temperatures: A terre haute case study. Urban Forestry & Urban Greening, 6, pp. 63–72. doi.org/10.1016/j.ufug.2007.01.005.
- Hermosilla, T., et al. (2018) Disturbance-informed annual land cover classification maps of Canada’s forested ecosystems for a 29-year landsat time series. Canadian Journal of Remote Sensing, 44, pp. 67–87. doi.org/10.1080/07038992.2018.1437719.
- Lu, Y., et al. (2017) Estimating urban vegetation fraction across 25 cities in pan-Pacific using Landsat time series data. ISPRS Journal of Photogrammetry and Remote Sensing, 126, pp. 11–23. doi.org/10.1016/j.isprsjprs.2016.12.014.
- Hermosilla, T., et al. (2012) Assessing contextual descriptive features for plot-based classification of urban areas. Landscape and Urban Planning, 106, pp. 124–137. doi.org/10.1016/j.landurbplan.2012.02.008.
- Wilson, J. S., et al. (2003) Evaluating environmental influences of zoning in urban ecosystems with remote sensing. Remote Sensing of Environment, 86, pp. 303–321. doi.org/10.1016/S0034-4257(03)00084-1.
- Weng, Q., et al. (2004) Estimation of land surface temperature–vegetation abundance relationship for urban heat island studies. Remote Sensing of Environment, 89, pp. 467–483. doi.org/10.1016/j.rse.2003.11.005.
- Tran, H., et al. (2006) Assessment with satellite data of the urban heat island effects in Asian mega cities. International Journal of Applied Earth Observation and Geoinformation, 8, pp. 34–48. doi.org/10.1016/j.jag.2005.05.003.
- Liao, J., et al. (2021) Evaluating the vertical cooling performances of urban vegetation scenarios in a residential environment. Journal of Building Engineering, 39, p. 102313. doi.org/10.1016/j.jobe.2021.102313.
- Srivanit, M & Hokao, K (2013) Evaluating the cooling effects of greening for improving the outdoor thermal environment at an institutional campus in the summer. Building and Environment, 66, pp. 158–172. doi.org/10.1016/j.buildenv.2013.04.012.
- Shi, D., et al. (2020) Synergistic cooling effects (SCEs) of urban green-blue spaces on local thermal environment: A case study in Chongqing, China. Sustainable Cities and Society, 55, p. 102065. doi.org/10.1016/j.scs.2020.102065.
- Cai, Y., et al. (2019) Spatiotemporal evolution of urban green space and its impact on the urban thermal environment based on remote sensing data: A case study of Fuzhou City, China. Urban Forestry & Urban Greening, 41, pp. 333–343. doi.org/10.1016/j.ufug.2019.04.012.
- Ko, Y (2018) Trees and vegetation for residential energy conservation: A critical review for evidence-based urban greening in North America. Urban Forestry & Urban Greening, 34, pp. 318–335. doi.org/10.1016/j.ufug.2018.07.021.
- Li, J., et al. (2019) Cooling and energy-saving performance of different green wall design: A simulation study of a block. Energies, 12, p. 2912. doi.org/10.3390/en12152912.
- Roy, D. P., et al. (2014) Landsat-8: Science and product vision for terrestrial global change research. Remote Sensing of Environment, 145, pp. 154–172. doi.org/10.1016/j.rse.2014.02.001.
- Geospatial Data Cloud. Available online: http://www.gscloud.cn.
- Li, Y., et al. (2015) Land Surface Temperature Estimation from Remote Sensing Data—A Case Study in Kun Ming City. In Proceedings of the 2015 23rd International Conference on Geoinformatics, Wuhan, China, pp. 19–21 June, pp. 1–6. doi.org/10.1109/GEOINFORMATICS.2015.7378590.
- Zheng, B., et al. (2018) Study on the Efficiency of Cool Island Effect in Urban Channel Water. In Proceedings of the 2018 3rd International Conference on Smart City and Systems Engineering (ICSCSE), Xiamen, China, pp. 29–30 December; pp. 140–145. doi.org/10.1109/ICSCSE.2018.00035.
- Sobrino, J. A., et al. (2004) Land surface temperature retrieval from LANDSAT TM 5. Remote Sensing of Environment, 90, pp. 434–440. doi.org/10.1016/j.rse.2004.02.003.
- Li, H (2017) Detection distance calculation model of flying target and atmospheric influence analysis. Optik, 129, pp. 248–255. doi.org/10.1016/j.ijleo.2016.10.069.
- Atmospheric Correction Parameter Calculator. Available at: http://atmcorr.gsfc.nasa.gov/.
- Hadjimitsis, D G & Clayton, C R (2008) The use of an improved atmospheric correction algorithm for removing atmospheric effects from remotely sensed images using an atmosphere–surface simulation and meteorological data. Meteorological Applications Journal Forecast Practical Application Train Technology Model, 15, pp. 381–387. doi.org/10.1002/met.80.
- Buytaert, W., et al. (2006) Spatial and temporal rainfall variability in mountainous areas: A case study from the south Ecuadorian Andes. Journal of Hydrology, 329, pp. 413–421. doi.org/10.1016/j.jhydrol.2006.02.031.
- Rosenfeld, A. H., et al. (1995) Mitigation of urban heat islands: Materials, utility programs, updates. Energy Building, 22, pp. 255–265. doi.org/10.1016/0378-7788(95)00927-P.
- Li, C., et al. (2014) Interaction between urban microclimate and electric air-conditioning energy consumption during high temperature season. Application Energy, 117, pp. 149–156. doi.org/10.1016/j.apenergy.2013.11.057.