May 25 2022
In the past few decades, there has been a global movement toward the use of clean energy sources. These energy sources have been shown to be ecologically beneficial and cost-effective over time. Recently, a team of researchers, writing in the journal Buildings, has considered daily global and diffuse solar radiation evaluated on a horizontal surface to establish the most efficient angles of installation.
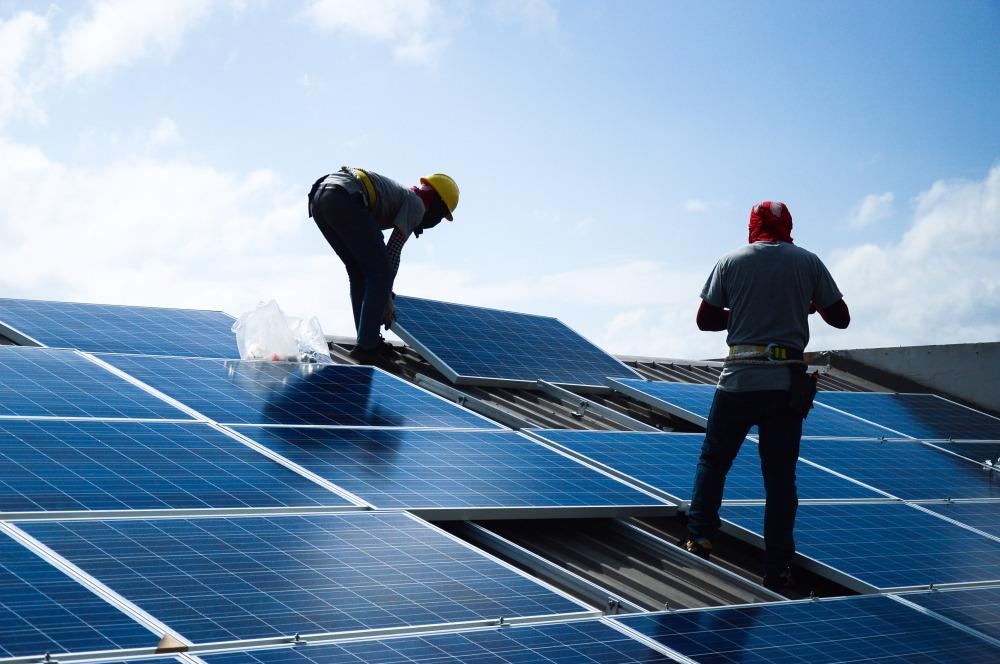
Study: A New Configuration of Roof Photovoltaic System for Limited Area Applications—A Case Study in KSA. Image Credit: surasak jailak/Shutterstock.com
Solar energy resources are seen as a game-changer that can help most Middle Eastern countries solve their power generation difficulties. As a result, Saudi Arabia (KSA) is one of the countries working to increase the use of solar energy to minimize its reliance on oil for energy production.
In the literature, specific case studies in KSA have been examined. The current study takes into account daily global and diffuse solar radiation evaluated on a horizontal surface. The ideal angle for each month permits the Madinah site in KSA to capture the most solar energy.
The scientists came to the conclusion that the annual ideal tilt angle is nearly equal to the latitude of the location. By optimizing the building envelope elements, it is possible to expand the solar energy performance of residential structures in KSA. Wall insulation, window area, roof insulation, window shading, window glazing, and thermal mass are all considered in the energy cost and energy-saving study.
Figure 1 demonstrates the expected progress towards raising the energy generated by renewable energy resources. According to KSA's vision, the targeted capacity by 2030 will be 58.7 GW.
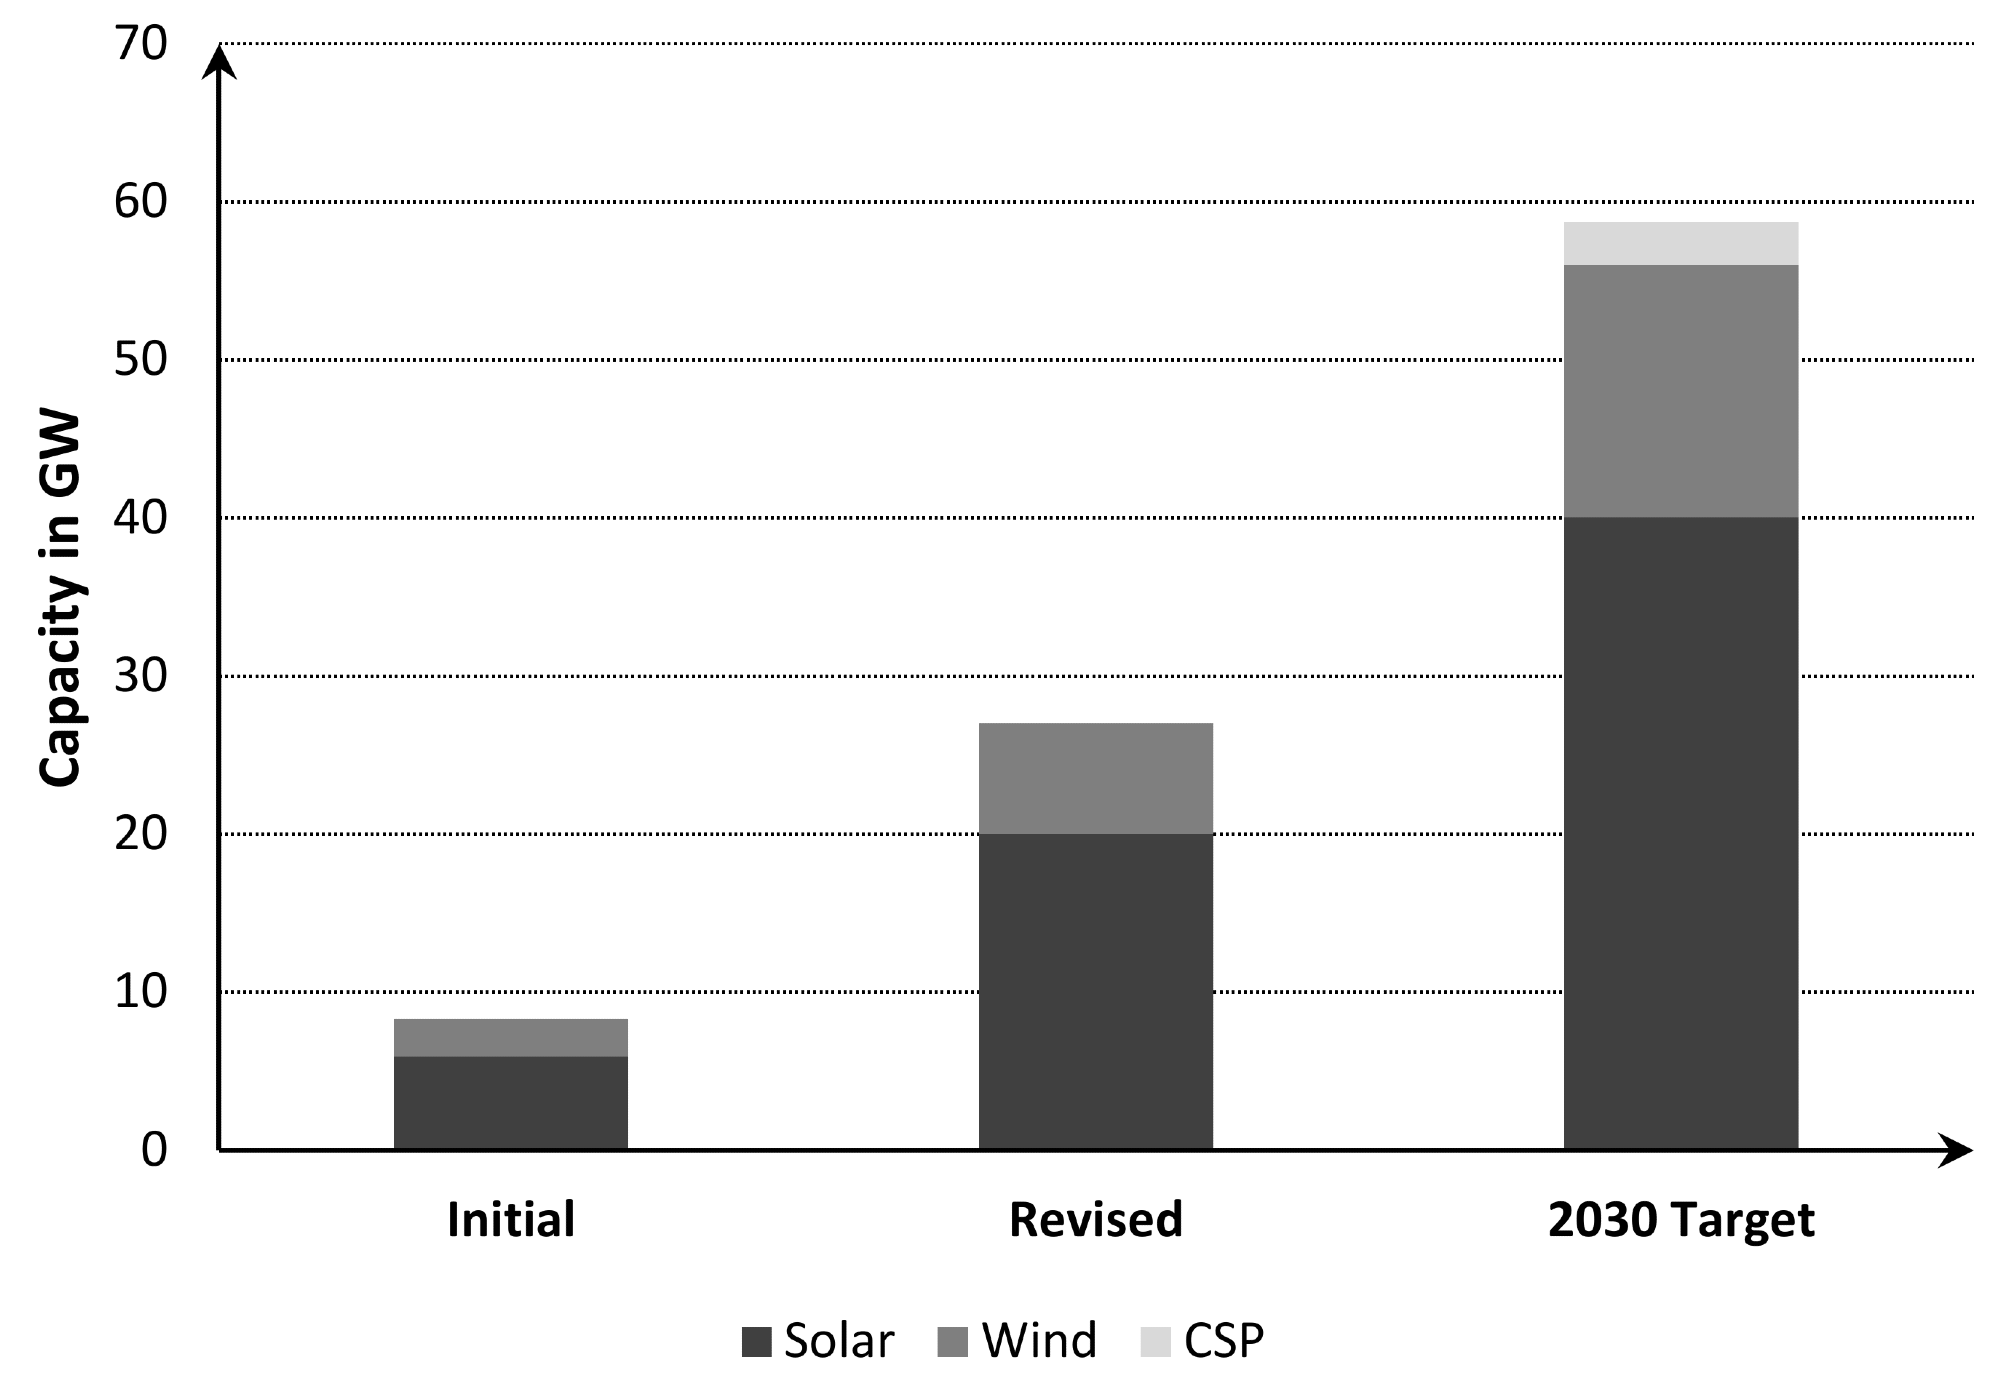
Figure 1. The vision of renewable energy in KSA for 2030. Image Credit: Al-Quraan, et al., 2022
The most essential angles that play a role in PV system design are depicted in Figure 2. Figure 3 shows the link between the PV system’s elevation angle and row spacing.
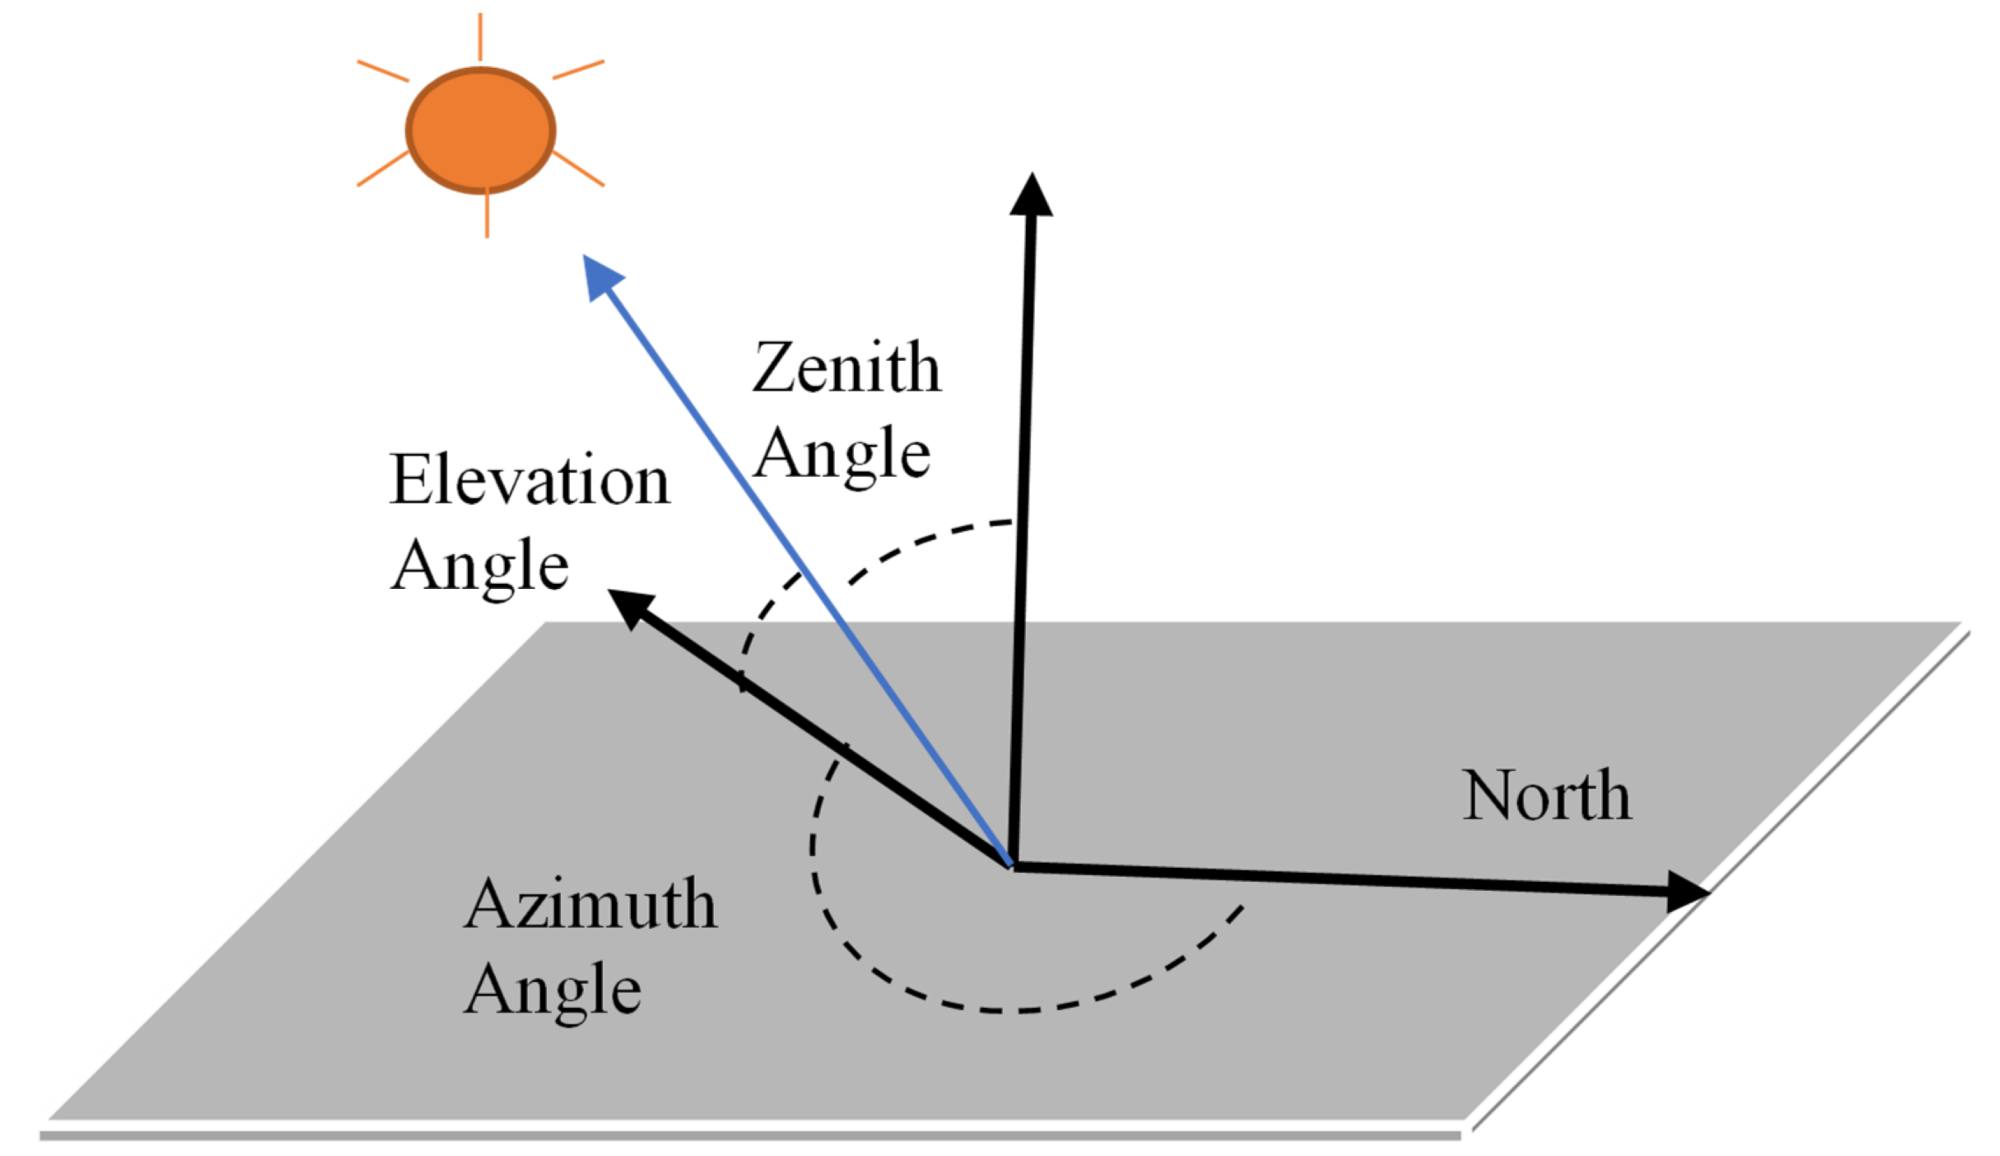
Figure 2. The main angles in PV system design. Image Credit: Al-Quraan, et al., 2022
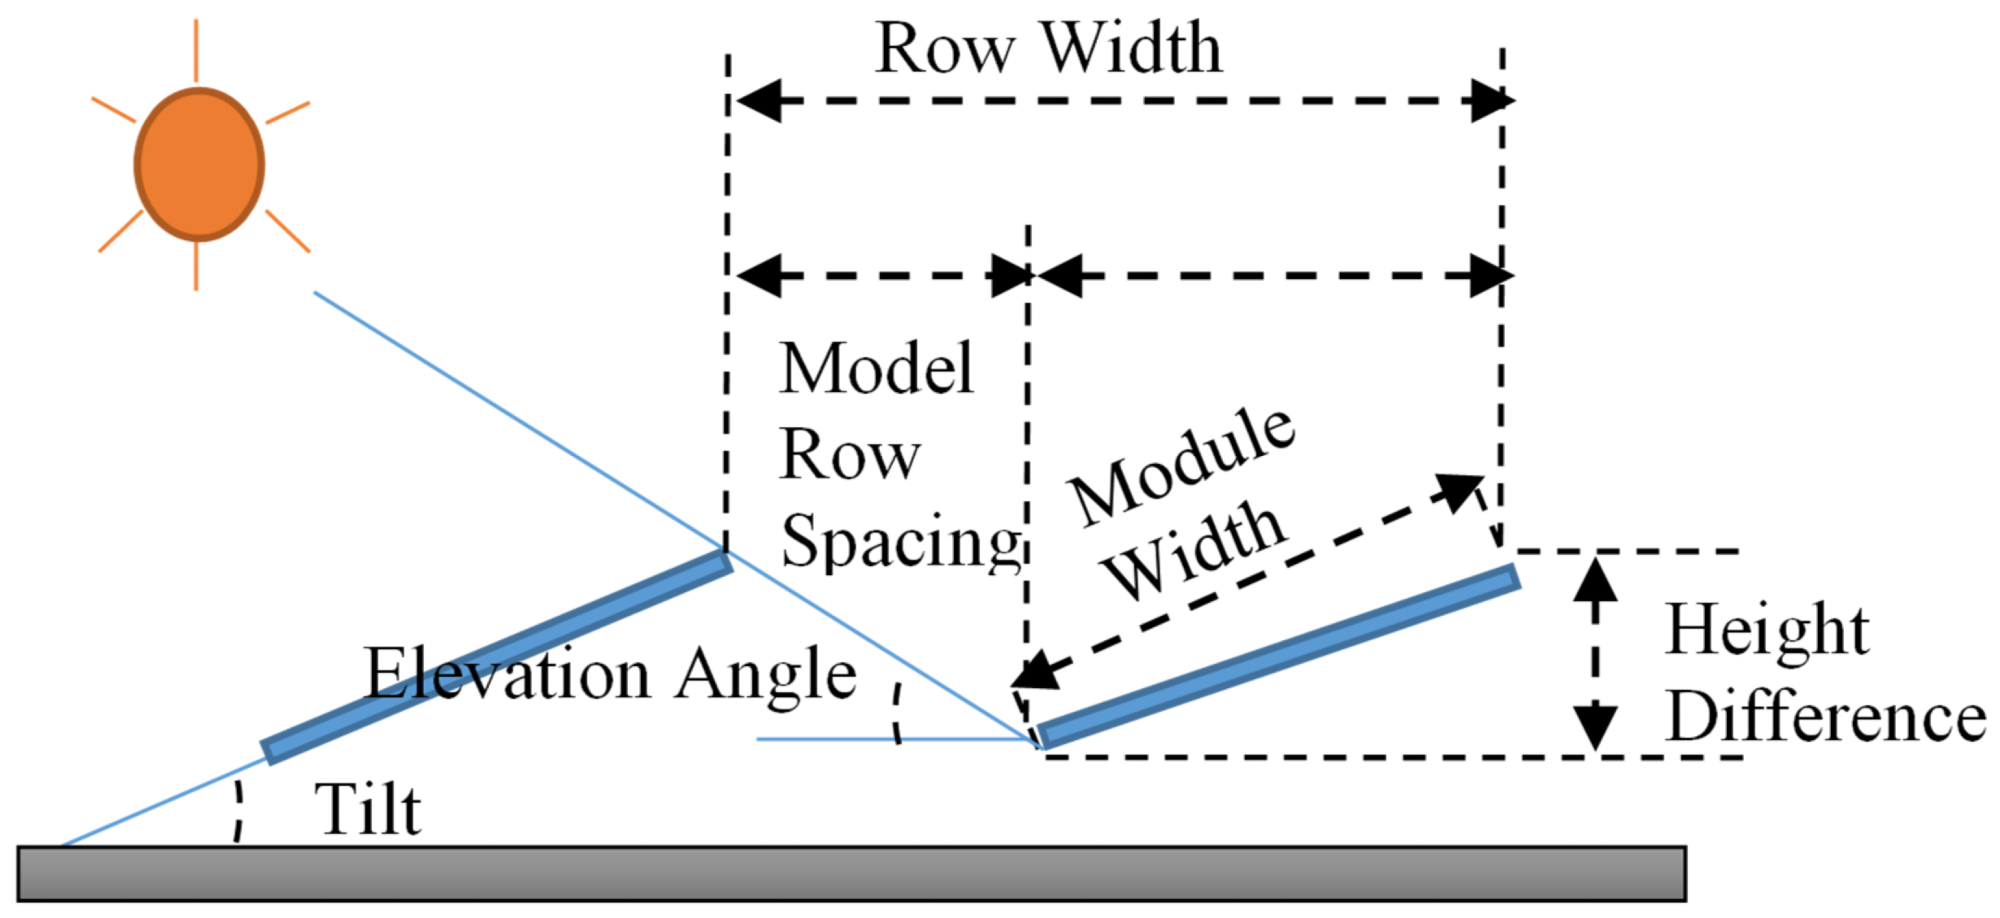
Figure 3. Relationship between elevation angle and spacing between rows. Image Credit: Al-Quraan, et al., 2022
The purpose of this research article is to fill the gap by giving a full solar analysis to evaluate the viability of installing a 330 KW on-grid PV system in KSA, specifically in Jeddah, and to introduce the right building method. The goal of the design is to determine the best manner to deploy solar panels on the roofs of Ministry buildings.
Methodology
The purpose of constructing this project is to lower the electricity bill by exploiting the blank spaces on building roofs and determining the best solar panel placement. The energy consumption of the building is shown in Table 1 on a monthly and annual basis.
Table 1. Monthly and annual energy consumption of the building. Source: Al-Quraan, et al., 2022
| Month |
Energy Consumption (kWh) |
| January |
952,500 |
| February |
949,100 |
| March |
942,000 |
| April |
937,500 |
| May |
932,500 |
| June |
930,100 |
| July |
928,100 |
| August |
938,100 |
| September |
939,300 |
| October |
941,800 |
| November |
942,500 |
| December |
948,500 |
| Annual energy (MWh) |
11,282 |
Due to the proposed tilt degree, the first scenario necessitated the installation of PV panels on three roofs. However, it was suggested that the tilt angle be increased to 21° to capture as much solar energy as feasible. Figure 4 shows the distribution.
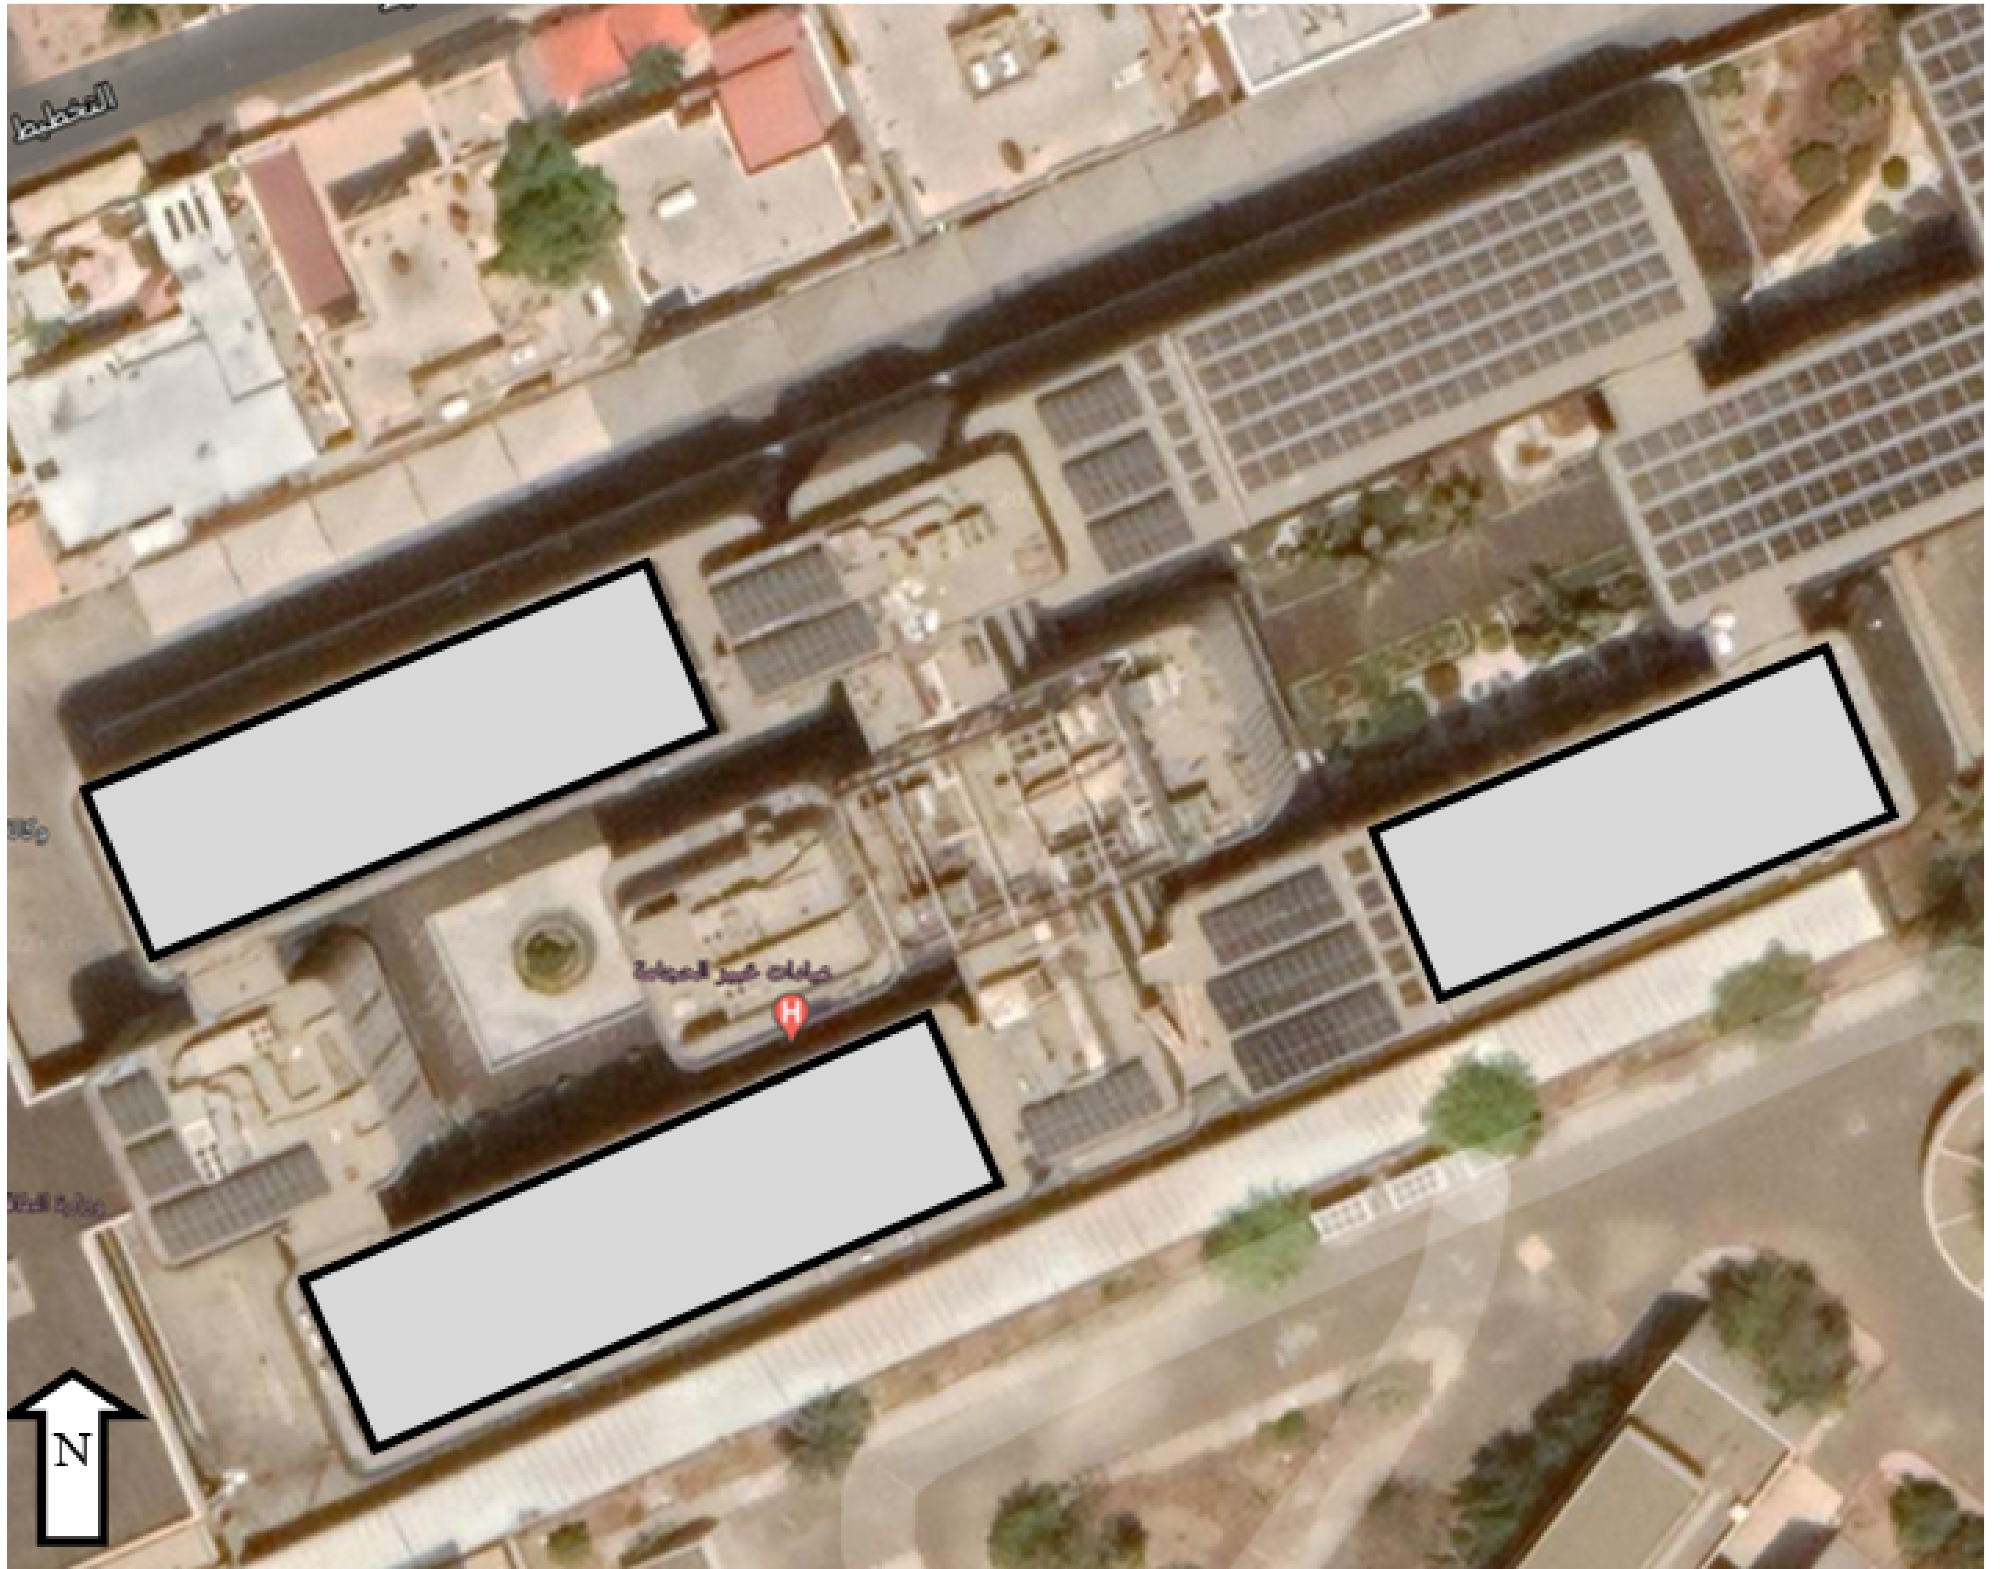
Figure 4. Distribution of the panels in the first scenario. Image Credit: Al-Quraan, et al., 2022
Figure 5 depicts the PV panel distribution on the horizontal surface in the second scenario, where the tilt angle is 15°.
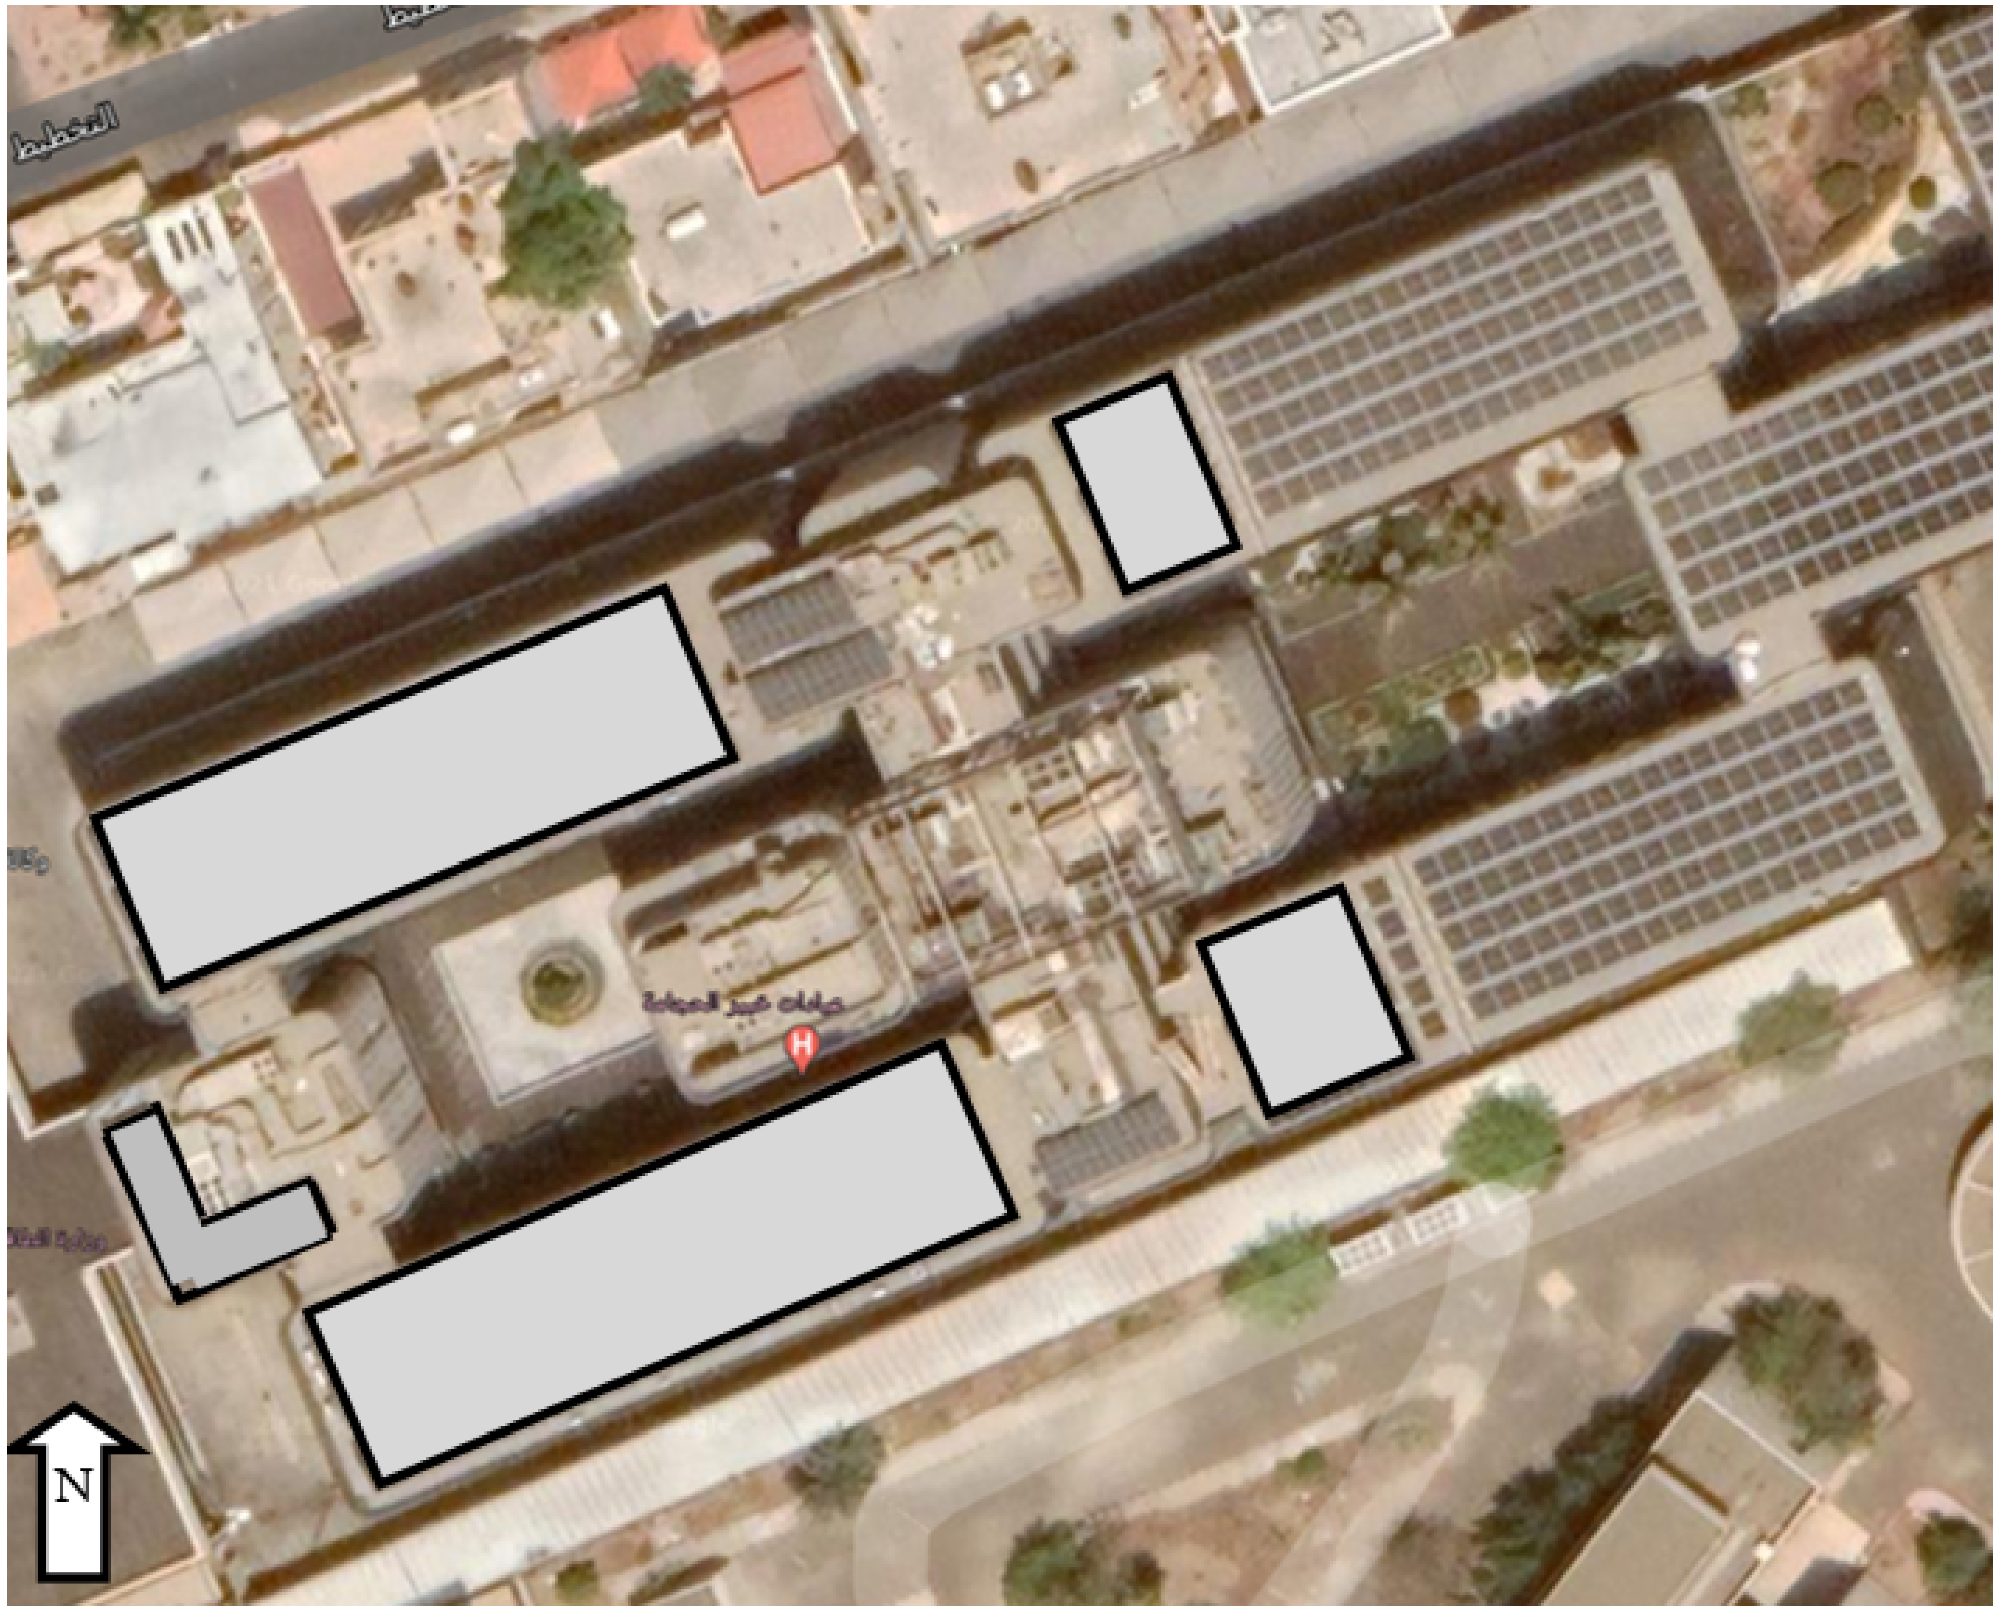
Figure 5. Distribution of the panels in the second scenario. Image Credit: Al-Quraan, et al., 2022
Figure 6 depicts the researchers’ proposed configuration, which can be utilized to cover the roofs of structures with limited space. For all circumstances, Figure 7 depicts the link between elevation angle and row spacing. The space between rows is considerably improved as the tilt angle is raised. As a result, the first scenario has the most row spacing.
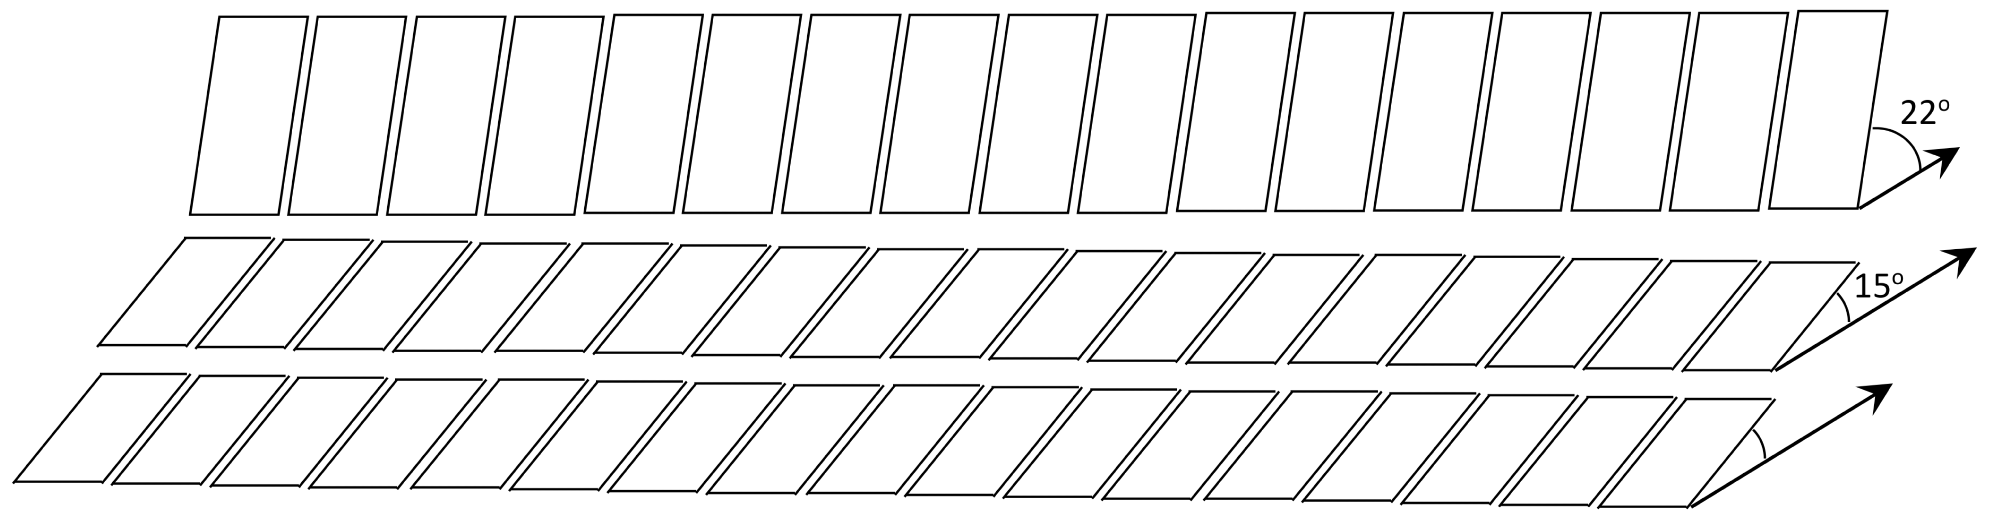
Figure 6. The configuration of the third scenario. Image Credit: Al-Quraan, et al., 2022
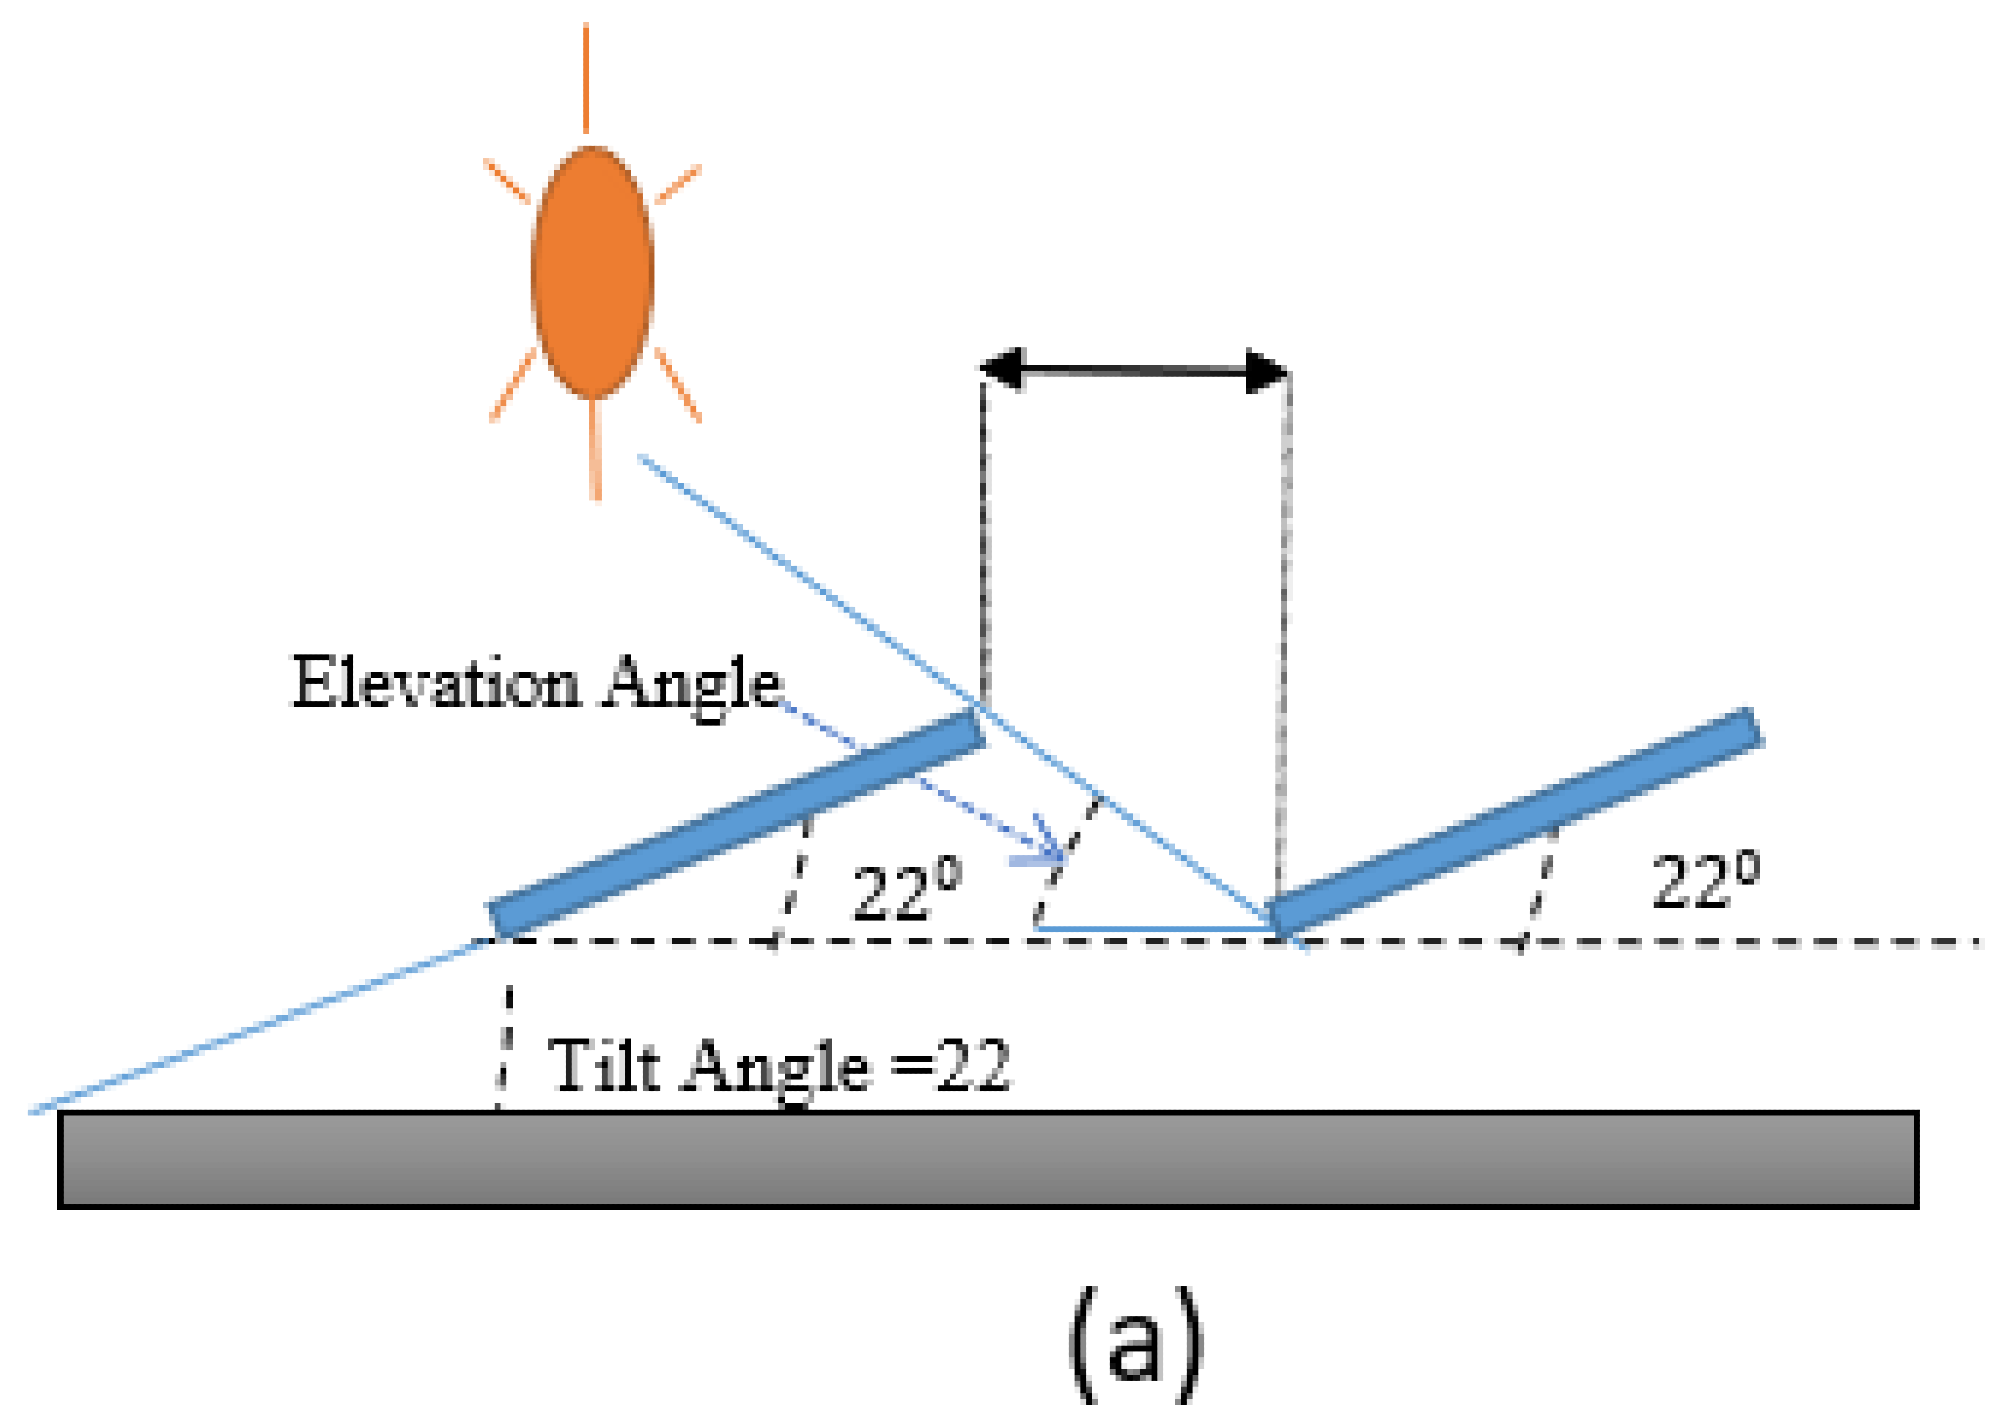
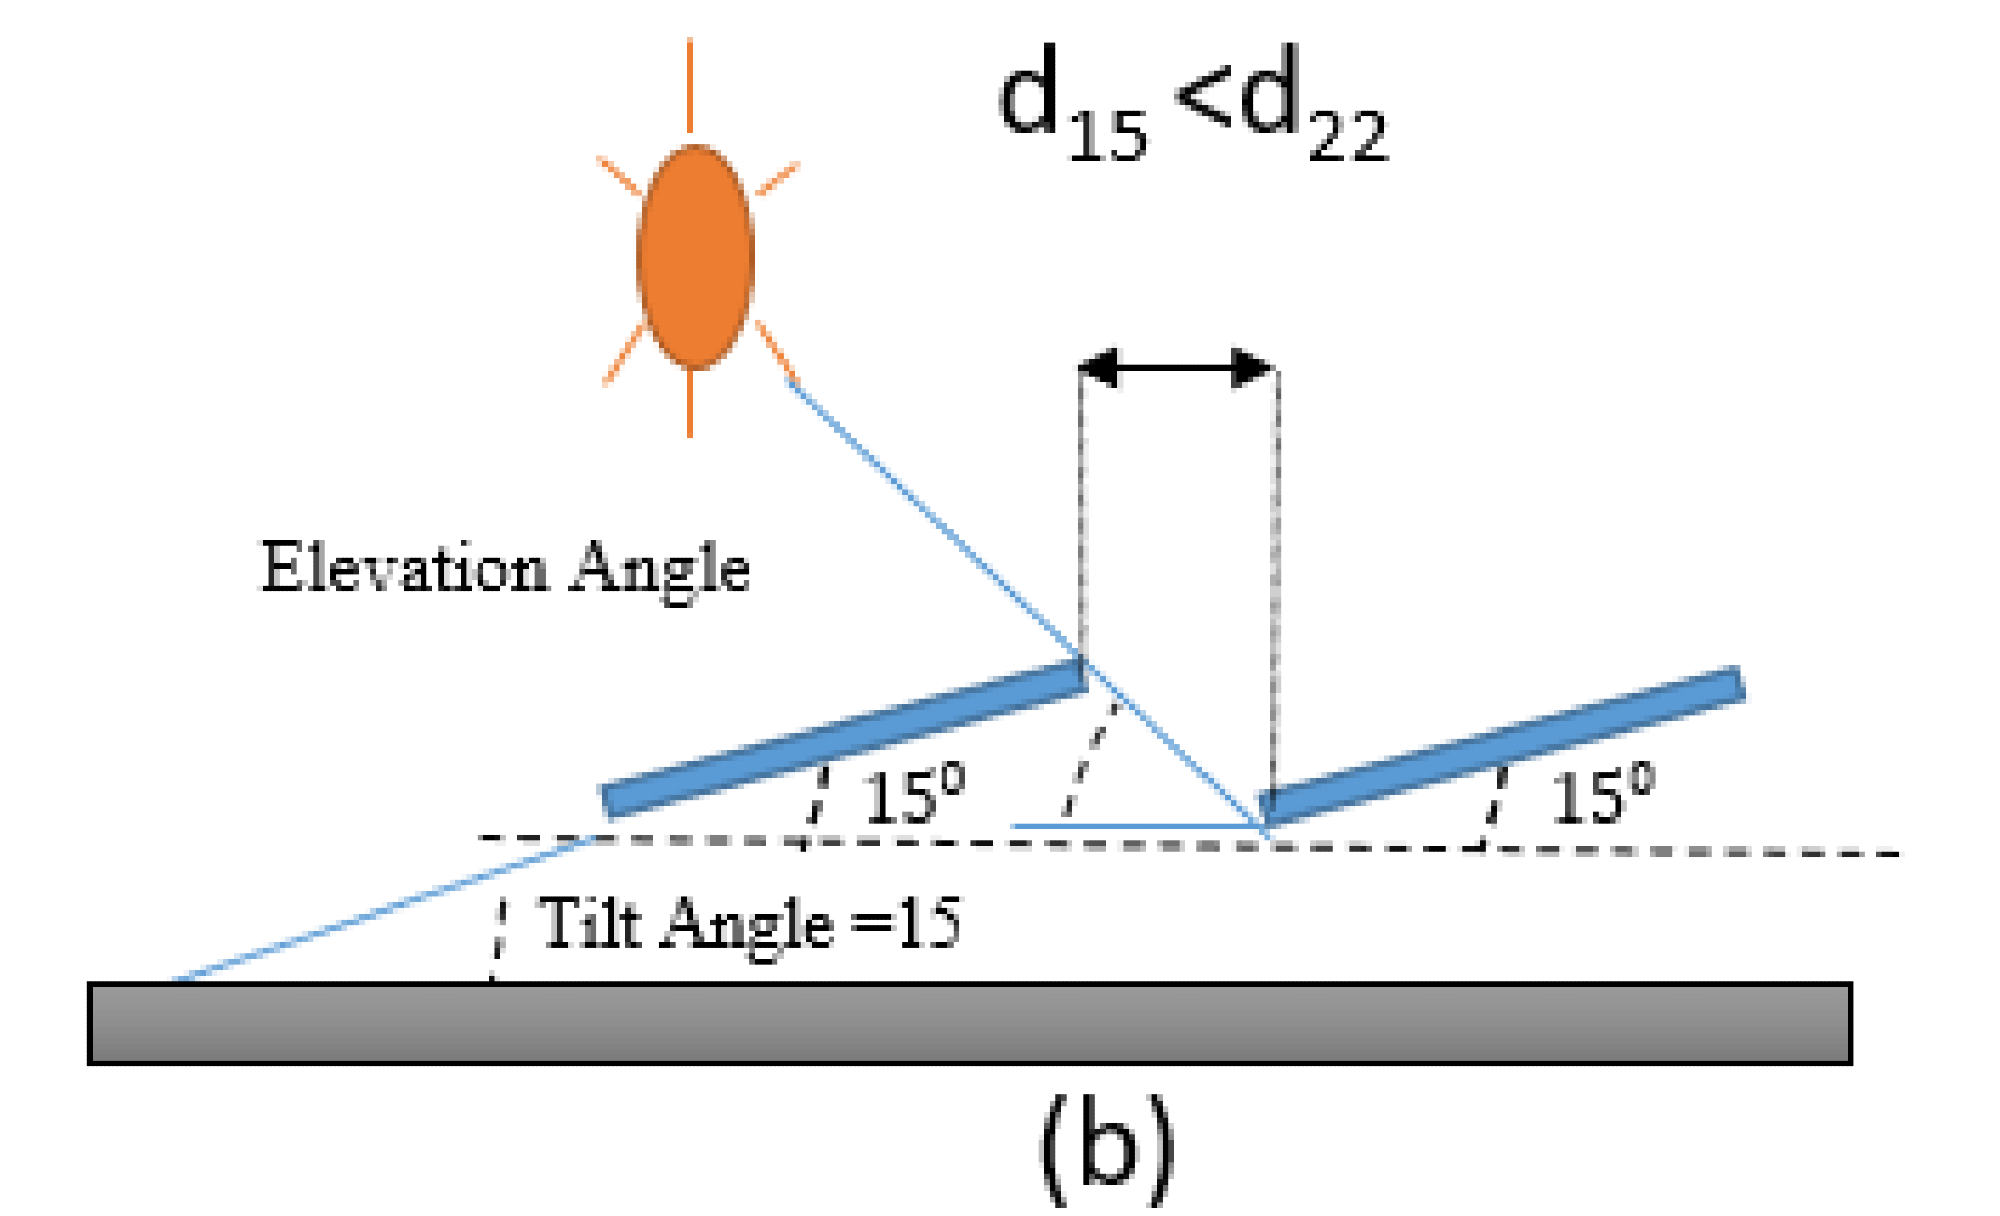
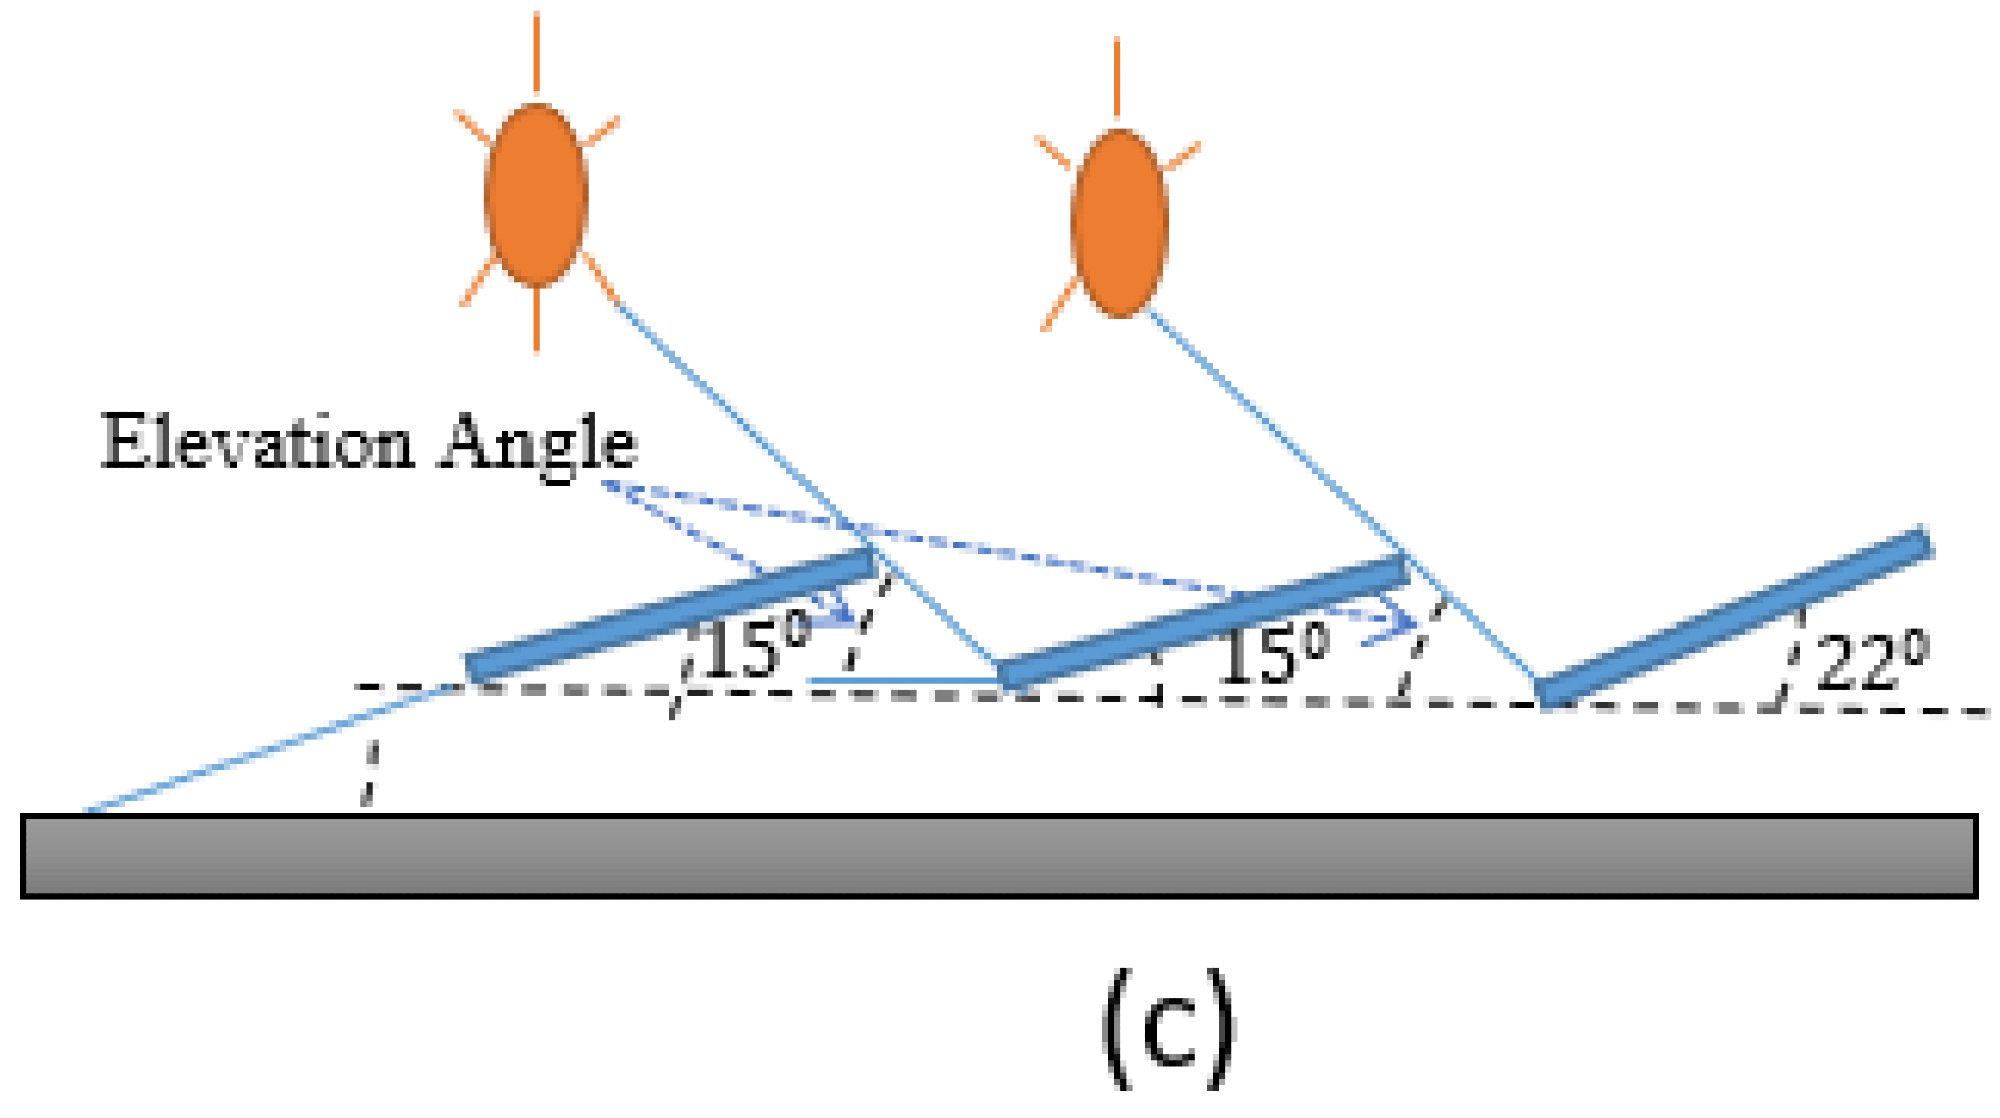
Figure 7. Relationship between elevation angle and spacing between rows: (a) Scenario 1, (b) Scenario 2, (c) Scenario 3. Image Credit: Al-Quraan, et al., 2022
Figure 8 shows a comparison of energy production across all scenarios. It’s worth noting that the first scenario produces the most energy, followed by the second and third scenarios. Figure 8 also shows the connecting diagram between the panels and the inverters.
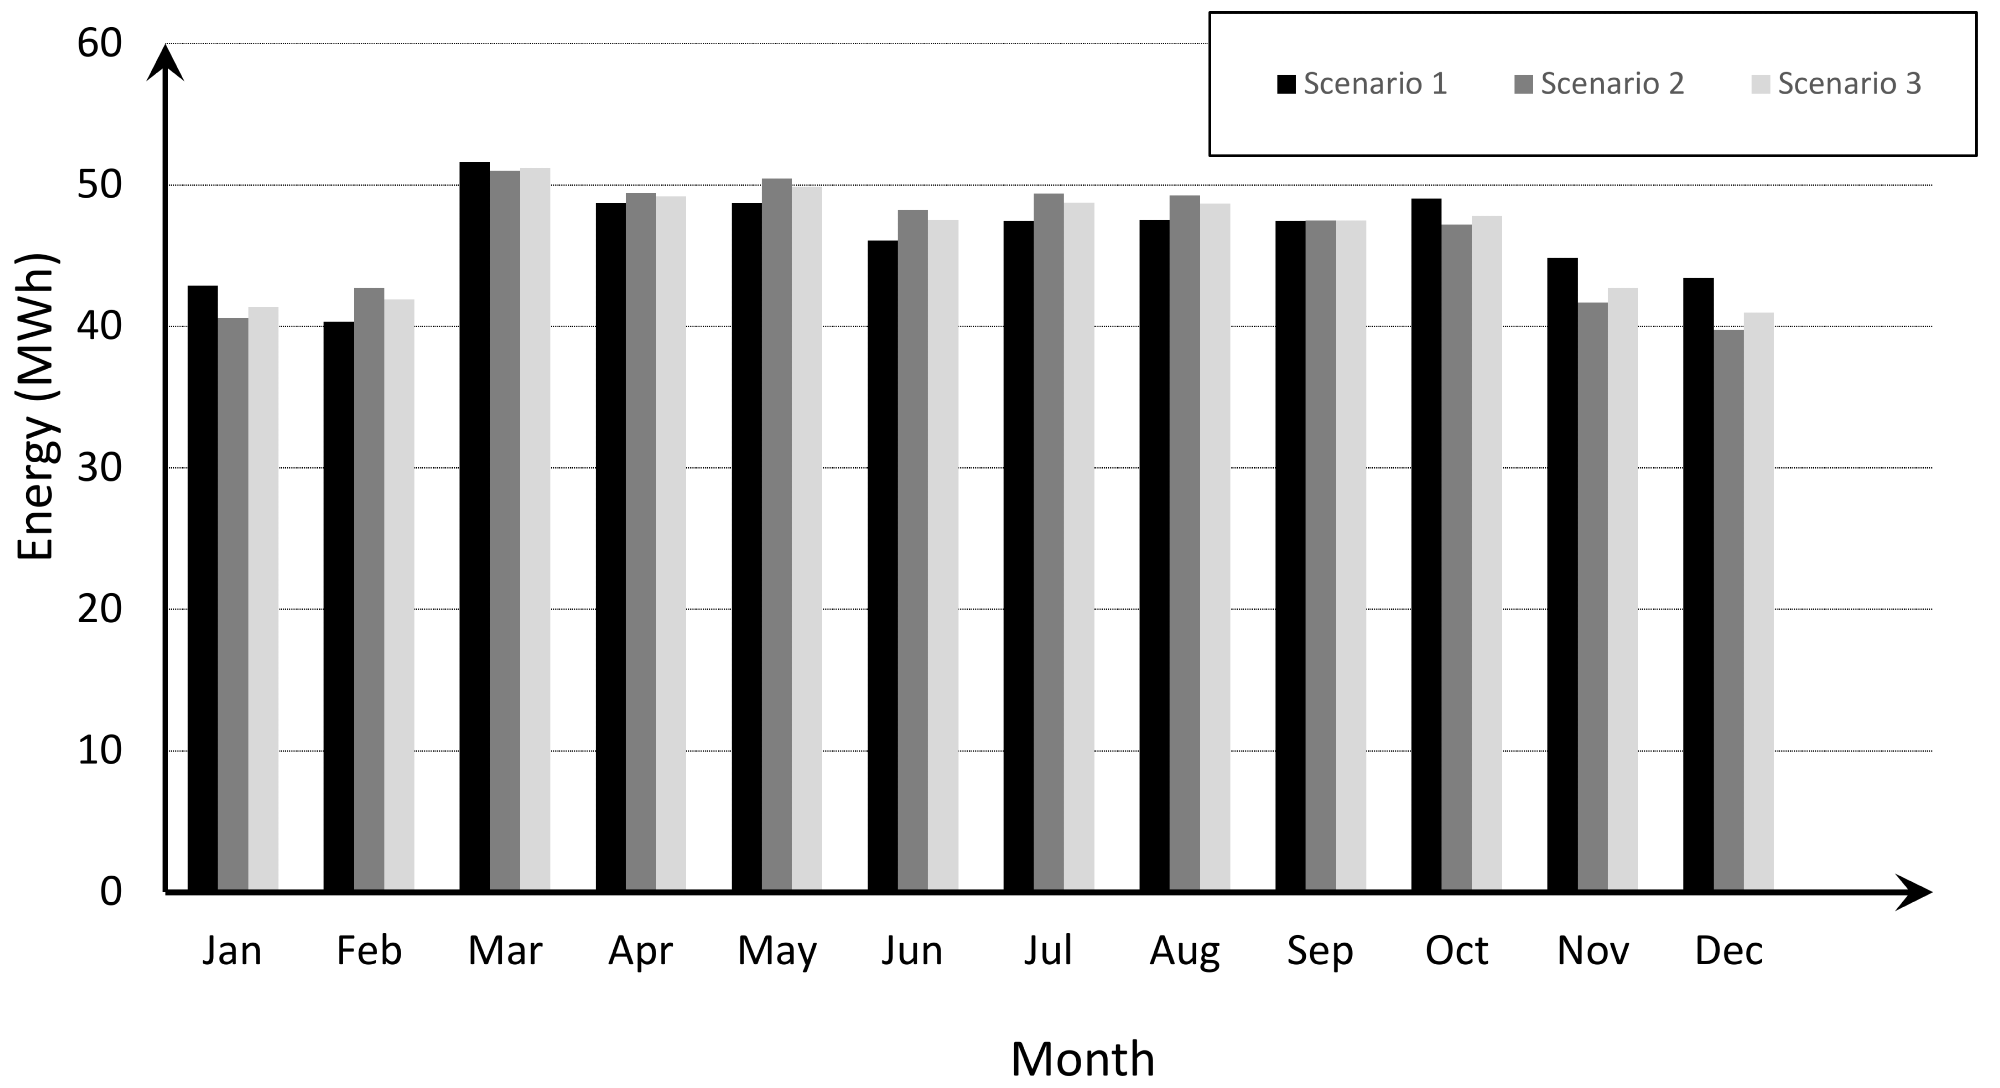
Figure 8. Energy production for all scenarios on a monthly basis. Image Credit: Al-Quraan, et al., 2022
Table 2 shows the tilt and elevation angles that were chosen, as well as the distances between the PV panels and the total roof area for each scenario. Solar irradiation in kWh/m2 at various inclination degrees is shown in Table 3.
Table 2. Selected angles, distances, and the total roof areas for all scenarios. Source: Al-Quraan, et al., 2022
| |
Angles and Distances |
| Scenario 1 |
Scenario 2 |
Scenario 3 |
| Tilt angle |
22° |
15° |
22° (First String)/15° (Others) |
| Elevation angle |
27° |
19.2° |
19.2° |
| Height difference (m) |
1.3 |
1.04 |
1.3 (First String)/1.04 (Others) |
| Model row spacing (m) |
1.73 |
1.42 |
1.42 |
| Total roof area (m2) |
2267.8 |
1893.77 |
1893.77 |
Table 3. Solar irradiance in (kWh/m2) at different inclination angles. Source: Al-Quraan, et al., 2022
| Month |
Inclination Angle (degree) |
Solar irradiance (kWh/m2) |
| January |
60 |
164 |
| February |
60 |
147 |
| March |
30 |
189 |
| April |
30 |
205 |
| May |
10 |
241 |
| June |
10 |
254 |
| July |
10 |
262 |
| August |
10 |
245 |
| September |
30 |
229 |
| October |
30 |
215 |
| November |
60 |
183 |
| December |
60 |
156 |
| Total energy |
|
2490 |
Figure 9 represents the way of using strings to link the PV models to the inverters. Table 4 also contains more information on the required system parameters and quantities.
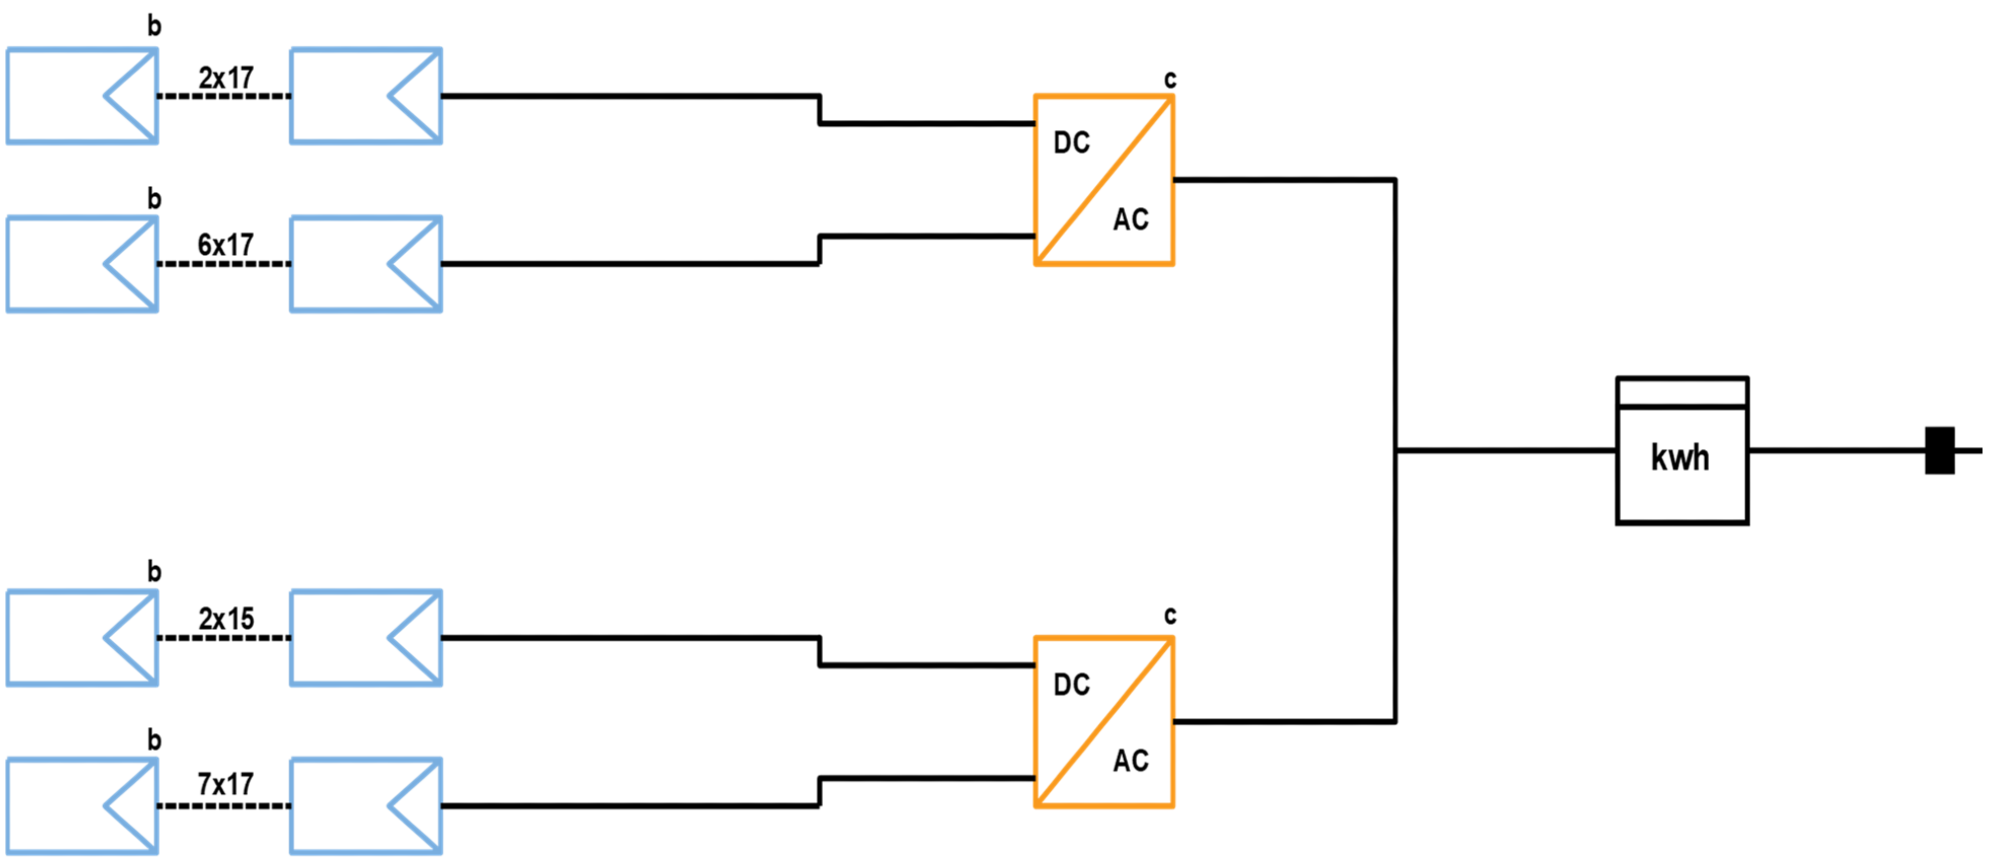
Figure 9. Connection diagram between the panels and the inverters. Image Credit: Al-Quraan, et al., 2022
Table 4. Equipment sizing details. Source: Al-Quraan, et al., 2022
| Case |
Type or Quantity |
| PV pannel surface |
2118 m2 |
| Dimensions of module |
2000 mm × 991 mm × 40 mm |
| Brand of PV modules |
JASOLAR |
| Model number |
JAM72S03-380/PR |
| Rated maximum power of PV module (W) |
380 |
| Type of cell |
Mono |
| Number of PV modules |
790 |
| Brand of inverters |
Chint |
| Model number |
CPS SCA50KTL-DO/400 |
| Rated AC output power (kW) |
50 |
| Number of inverters |
6 |
| Installation type |
Rooftop |
Figure 10 shows a single-line diagram (SLD) for the distribution system of low and medium voltages. This proposal was structured according to the Ministry of Electricity grid integration requirements.
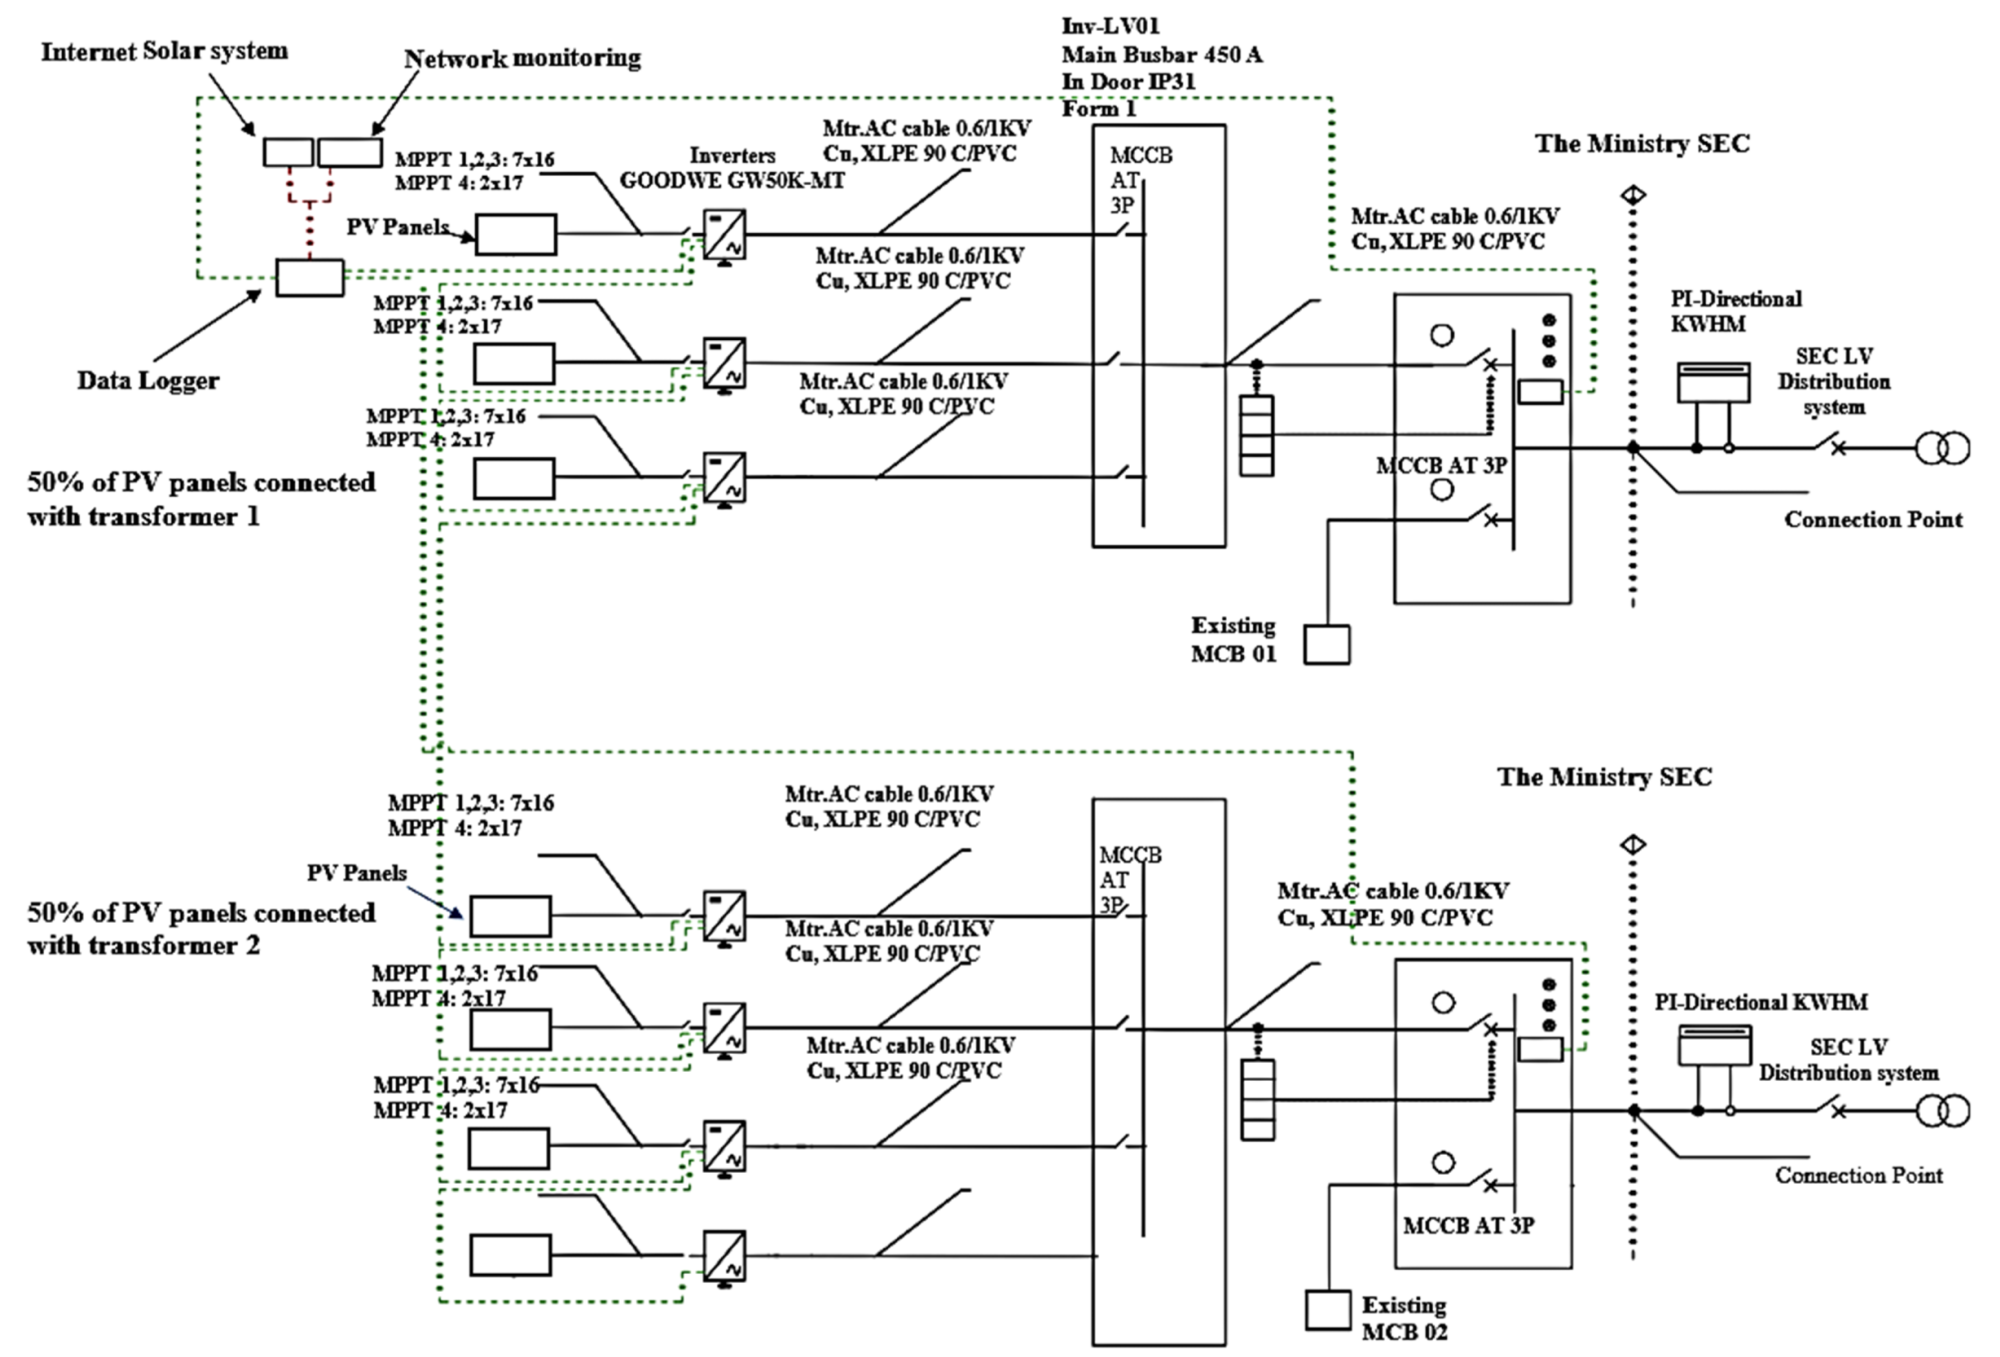
Figure 10. Single-line diagram of the entire system. Image Credit: Al-Quraan, et al., 2022
Results and Discussion
Table 5 shows the expected energy for the studied location during the course of the year, based on three possible scenarios. Table 6 shows the estimated average energy consumption on a monthly basis.
Table 5. Monthly and annual estimated energy production of all scenarios in kWh. Source: Al-Quraan, et al., 2022
| Month |
22° Tilt
Angle |
15° Tilt
Angle |
Configuration Proposed
by the Author |
| January |
42,863.72 |
40,586.62 |
41,346.98 |
| February |
43,120.12 |
42,701.92 |
41,905.32 |
| March |
51,605.42 |
50,982.12 |
51,189.88 |
| April |
48,698.62 |
49,404.42 |
49,169.15 |
| May |
48,710.22 |
50,453.52 |
49,872.42 |
| June |
46,055.82 |
48,218.22 |
47,497.42 |
| July |
47,434.52 |
49,388.12 |
48,736.92 |
| August |
47,504.22 |
49,234.62 |
48,657.95 |
| September |
47,435.52 |
47,469.221 |
47,458.12 |
| October |
49,030.32 |
47,195.12 |
47,806.98 |
| November |
44,819.02 |
41,655.71 |
42,710.34 |
| December |
43,419.12 |
39,732.51 |
40,961.58 |
| Annual energy production |
560,696.64 |
557,025.33 |
557,313.06 |
Table 6. Comparison between estimated and measured energy output of the PV system in kWh, with percentage error calculations. Source: Al-Quraan, et al., 2022
| |
Estimated at 15° Tilt |
Measured |
Percentage Error % |
| August |
49,234.62 |
47,909.40 |
2.69 |
| September |
47,469.221 |
44,873.24 |
5.46 |
| October |
47,195.12 |
40,545.59 |
14.10 |
| November |
41,655.71 |
33,842.27 |
18.75 |
| December |
39,732.51 |
34,447.50 |
13.30 |
| January 2020 |
40,586.62 |
35,971.36 |
11.37 |
Conclusion
This research proposed a new PV design for limited-area applications that can be installed on the roofs of buildings. The recommended arrangement is based on determining the best tilt angle for the PV system’s first string, which generates the most energy. In this setup, the other strings of the PV system can be chosen to eliminate shade on the limited-area roofs.
This concept, however, should only be used if the roof’s area is unrestricted. The proposed design produces more energy than the second scenario, which was used to meet the limited roof surface.
The proposed design can be employed on a regular basis on building rooftops where the roof space is limited to produce more energy. Furthermore, this setup can be used with small-capacity PV systems.
Journal Reference:
Al-Quraan, A., Al-Mahmodi, M., Al-Asemi, T., Bafleh, A., Bdour, M., Muhsen, H., Malkawi, A. (2022) A New Configuration of Roof Photovoltaic System for Limited Area Applications—A Case Study in KSA. Buildings, 12(2), p. 92. Available Online: https://doi.org/10.3390/buildings12020092
References and Further Reading
- Zell, E., et al. (2015) Gasim, S.; Wilcox, S.; Katamoura, S.; Stoffel, T.; Shibli, H.; Engel-Cox, J.; Al Subie, M. Assessment of solar radiation resources in Saudi Arabia. Solar Energy, 119, pp.422–438. doi.org/10.1016/j.solener.2015.06.031.
- Jurgenson, S., et al. (2016) A comprehensive renewable energy program for Saudi Vision 2030. Renewable Energy Focus, 17, pp.182–183. doi.org/10.1016/j.ref.2016.08.006.
- Yamada, M (2016) Vision 2030 and the Birth of Saudi Solar Energy; Middle East Institute: Singapore; p.13.
- Alshuwaikhat, H & Mohammed, I (2017). Sustainability Matters in National Development Visions—Evidence from Saudi Arabia’s Vision for 2030. Sustainability, 9, p.408. doi.org/10.3390/su9030408.
- Heffron, R J (2021) Just Transitions Around the World. In Achieving a Just Transition to a Low-Carbon Economy; Palgrave Macmillan: Cham, Switzerland, 2021; pp.87–124.
- Delbeke, J & Lamas, R (2021) Exploring Carbon Market Instruments for the Kingdom of Saudi Arabia (KSA); European University Institute: Fiesole, Italy.
- Mosly, I & Makki, A A (2018) Current status and willingness to adopt renewable energy technologies in Saudi Arabia. Sustainability, 10, p.4269. doi.org/10.3390/su10114269.
- Mas’ud, A. A., et al. (2018) Solar energy potentials and benefits in the gulf cooperation council countries: A review of substantial issues. Energies, 11, p.372. doi.org/10.3390/en11020372.
- Dehwah, A H & Asif, M (2019) Assessment of net energy contribution to buildings by rooftop photovoltaic systems in hot-humid climates. Renewable Energy, 131, pp.1288–1299. https://doi.org/10.1016/j.renene.2018.08.031.
- Ethraa Home Page. Net Metering and 4 Ways Saudi Arabia can implement it. Available at: https://www.ethraa-a.com/
- Ko, W., et al. (2019) Development of Feed-in Tariff for PV in the Kingdom of Saudi Arabia. Energies, 12, p.2898. doi.org/10.3390/en12152898.
- Benghanem, M (2011) Optimization of tilt angle for solar panel: Case study for Madinah, Saudi Arabia. Applied Energy, 88, pp.1427–1433. doi.org/10.1016/j.apenergy.2010.10.001.
- Alaidroos, A & Krarti, M (2015) Optimal design of residential building envelope systems in the Kingdom of Saudi Arabia. Energy and Buildings, 86, pp.104–117. doi.org/10.1016/j.enbuild.2014.09.083.
- Gharakhani Siraki, A & Pillay, P (2012) Study of optimum tilt angles for solar panels in different latitudes for urban applications. Solar Energy, 86, pp.1920–1928. doi.org/10.1016/j.solener.2012.02.030.
- Nguyen, H T & Pearce, J M (2013). Automated quantification of solar photovoltaic potential in cities. International Review for Spatial Planning and Sustainable Development, 1, pp.49–60. doi.org/10.14246/irspsd.1.1_49.
- Hong, T., et al. (2017) Development of a method for estimating the rooftop solar photovoltaic (PV) potential by analyzing the available rooftop area using Hillshade analysis. Applied Energy, 194, pp.320–332. doi.org/10.1016/j.apenergy.2016.07.001.
- Redweik, P., et al. (2013). Solar energy potential on roofs and facades in an urban landscape. Solar Energy, 97, pp.332–341. doi.org/10.1016/j.solener.2013.08.036.
- Mangiante, M. J., et al. (2020) Economic and technical assessment of rooftop solar photovoltaic potential in Brownsville, Texas, USA. Computers, Environment and Urban Systems, 80, p.101450. doi.org/10.1016/j.compenvurbsys.2019.101450.
- Byrne, J., et al. (2015) A review of the solar city concept and methods to assess rooftop solar electric potential, with an illustrative application to the city of Seoul. Renewable and Sustainable Energy Reviews, 41, pp.830–844. doi.org/10.1016/j.rser.2014.08.023.
- Izquierdo, S., et al. (2008) A method for estimating the geographical distribution of the available roof surface area for large-scale photovoltaic energy-potential evaluations. Solar Energy, 82, pp.929–939. doi.org/10.1016/j.solener.2008.03.007.
- Desthieux, G., et al. (2018). Solar energy potential assessment on rooftops and facades in large built environments based on lidar data, image processing, and cloud computing. Methodological background, application, and validation in geneva (solar cadaster). Frontiers Built Environment, 4, p.14. doi.org/10.3389/fbuil.2018.00014.
- Mainzer, K., et al. (2017) Assessment of rooftop photovoltaic potentials at the urban level using publicly available geodata and image recognition techniques. Solar Energy, 155, pp.561–573. doi.org/10.1016/j.solener.2017.06.065.
- Singh, R & Banerjee, R (2015). Estimation of rooftop solar photovoltaic potential of a city. Solar Energy, 115, pp.589–602. doi.org/10.1016/j.solener.2015.03.016.
- Berwal, A K (2017). Design and analysis of rooftop grid tied 50 kW capacity Solar Photovoltaic (SPV) power plant. Renewable and Sustainable Energy Reviews, 77, pp.1288–1299. doi.org/10.1016/j.rser.2017.03.017.
- Kumar, B S & Sudhakar, K (2015). Performance evaluation of 10 MW grid connected solar photovoltaic power plant in India. Energy Reports, 1, pp.184–192. doi.org/10.1016/j.egyr.2015.10.001.
- Khatib, T., et al. (2016) A review on sizing methodologies of photovoltaic array and storage battery in a standalone photovoltaic system. Energy Conversion and Management, 120, pp.430–448. doi.org/10.1016/j.enconman.2016.05.011.
- Kumar, A (2021). Design and Analysis of Solar PV Rooftop in Motihari. Journal of Physics: Conference Series, 1817, p.12019. doi.org/10.1088/1742-6596/1817/1/012019.
- Kadyan, H & Berwal, A.K (2018). Design of a 12 kWp grid connected roof top solar photovoltaic power plant on school building in the Rohtak District of Haryana. International Journal of Applied Engineering Research, 13, pp.11354–11361.
- Mokhtara, C., et al. (2021) Optimal design of grid-connected rooftop PV systems: An overview and a new approach with application to educational buildings in arid climates. Sustainable Energy Technologies and Assessments, 47, p.101468. doi.org/10.1016/j.seta.2021.101468.
- Khatib, T., et al. (2012) A New Approach for Optimal Sizing of Standalone Photovoltaic Systems. International Journal of Photoenergy, 2012, p.391213. doi.org/10.1155/2012/391213.
- Markvart, T., et al. (2006). PV system sizing using observed time series of solar radiation. Solar Energy, 80, pp. 46–50. doi.org/10.1016/j.solener.2005.08.011.
- Wissem, Z., et al. (2012). Modeling and technical–economic optimization of an autonomous photovoltaic system. Energy, 37, pp.263–272. doi.org/10.1016/j.energy.2011.11.036.
- Hay, J E (1979) Calculation of monthly mean solar radiation for horizontal and inclined surfaces. Solar Energy, 23, pp.301–307. doi.org/10.1016/0038-092X(79)90123-3.
- Jaber, S & Hawa, A A (2016) Optimal design of PV system in passive residential building in Mediterranean climate. Jordan Journal of Mechanical and Industrial Engineering, 10, pp.39–49.
- Duffie, J A & Beckman, W A (2013) Solar Engineering of Thermal Processes, 4th ed.; John Wiley & Sons: Hoboken, NJ, USA.
- Radaideh, A., et al. (2021). Active and Reactive Power Control for Wind Turbines Based DFIG Using LQR Controller with Optimal Gain-Scheduling. Journal of Electrical and Computer Engineering, 2021, p.1218236. doi.org/10.1155/2021/1218236.
- Al-Mhairat, B & Al-Quraan, A (2022) Assessment of Wind Energy Resources in Jordan Using Different Optimization Techniques. Processes, 10, p.105. doi.org/10.3390/pr10010105.
- Al-Quraan, A., et al. (2021) Design and Control of a Standalone Hybrid PV-Wind Micro-Grid System. Energies, 14, p.4849. doi.org/10.3390/en14164849.
- Yakup, M., et al. (2021) Optimum tilt angle and orientation for solar collector in Brunei Durassalam. Renewable Energy, 24, pp.223–234. doi.org/10.1016/S0960-1481(00)00168-3.
- Amelia, A.R., et al. (2016) Investigation of the effect temperature on photovoltaic (PV) panel output performance. International Journal on Advanced Science, Engineering and Information Technology, 6, pp.682–688.
- Dubey, S., et al. (2013) Temperature Dependent Photovoltaic (PV) Efficiency and Its Effect on PV Production in the World—A Review. Energy Procedia, 33, pp.311–321. doi.org/10.1016/j.egypro.2013.05.072.
- Al-Quraan, A., et al. (2016) Comparison of Wind Tunnel and on Site Measurements for Urban Wind Energy Estimation of Potential Yields. Elsevier Journal of Wind Engineering and Industrial Aerodynamics, 158, pp.1–10. doi.org/10.1016/j.jweia.2016.08.011.
- Stathopoulos, T., et al. (2018) Urban Wind Energy: Some Views on Potential and Challenges. Elsevier Journal of Wind Engineering and Industrial Aerodynamics, 179, pp.146–157. doi.org/10.1016/j.jweia.2018.05.018.
- Al-Quraan, A., et al. (2017) Use of a Wind Tunnel for Urban Wind Power Estimation. In Proceedings of the IEEE Power & Energy Society General Meeting, Washington, DC, USA, 27–31 July 2014.
- Al-Quraan, A & Alrawashdeh, H (2018) Correlated Capacity Factor Strategy for Yield Maximization of Wind Turbine Energy. In Proceedings of the IEEE 5th International Conference on Renewable Energy Generation and Applications (ICREGA), Al-Ain, United Arab Emirates, 26–28 February 2018
- Al-Quraan, A., et al. (2014) Estimation of Urban Wind Energy-Equiterre Building Case in Montreal. In Proceedings of the International Civil Engineering for Sustainability and Resilience Conference (CESARE’14), Irbid, Jordan, 24–27 April.