In recent research in the journal Architecture, scientists tested the performance of hydrated lime reinforced with low-cost hemp fibers as a more sustainable material substitution.
Study: Lime-Based Plaster Reinforced with Hemp Braids as Sustainable Building Product. Image Credit: Tarun Jami/Shutterstock.com
The construction sector, which consumes a lot of primary energy and emits a significant amount of CO2, is very interested in environmental sustainability. As a result, novel materials have been explored and recommended as substitutes for standard materials to promote more sustainable civil engineering methods.
The goal is to replace elements that are hazardous to humans or cause environmental pollution with components produced from renewable sources or that are biodegradable.
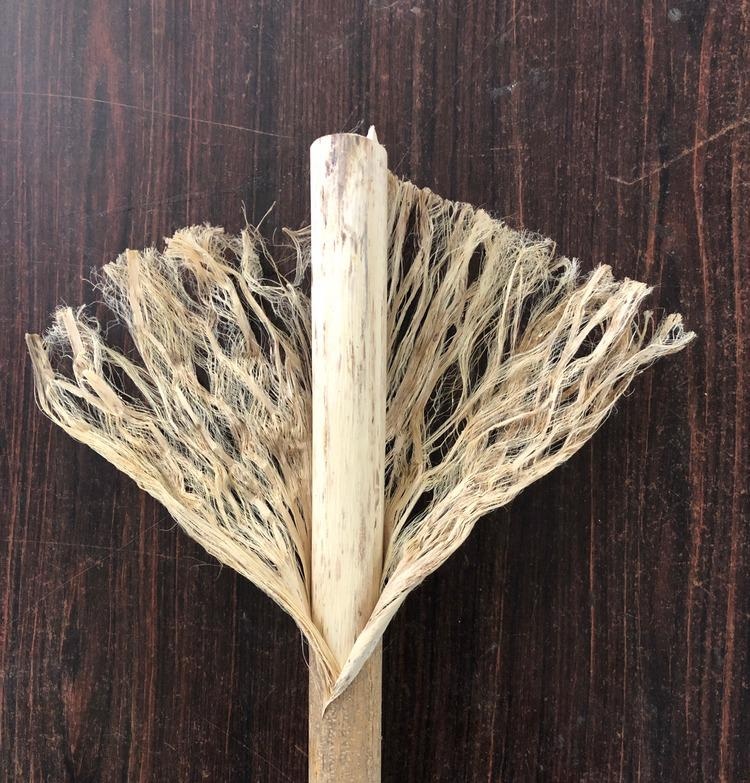
Due to their strength and toughness, plant-based fibers are the best choice for construction purposes. Mechanical characterization of a variety of species, including jute, hemp, flax, bamboo, kenaf, and ramie, has been the focus of recent research. The highest Young’s moduli and tensile strengths are found in flax, hemp, and ramie fibers.
Hemp may be used to make bricks, blocks, panels, plasters, coatings, and screeds, and can therefore be utilized for a wide range of applications in new and ancient buildings thanks to its physical and mechanical features.
The goal of this study is to investigate the performance of a novel reinforced hydrated lime using low-cost hemp fibers with minimal manufacturing or preceding transformation. It incorporates earlier research into determining the tensile strength of hemp stems.
The study also aims to analyze how hemp braids react with hydrated lime to see if they can replace standard glass fiber meshes in limiting the negative shrinkage effect produced by fractures in the binder material.
Hemp braids obtained from organic farming with little environmental impact are added with hydrated lime in the experimental activity established and described here. The flow chart in Figure 1 summarizes the entire experimental setup.
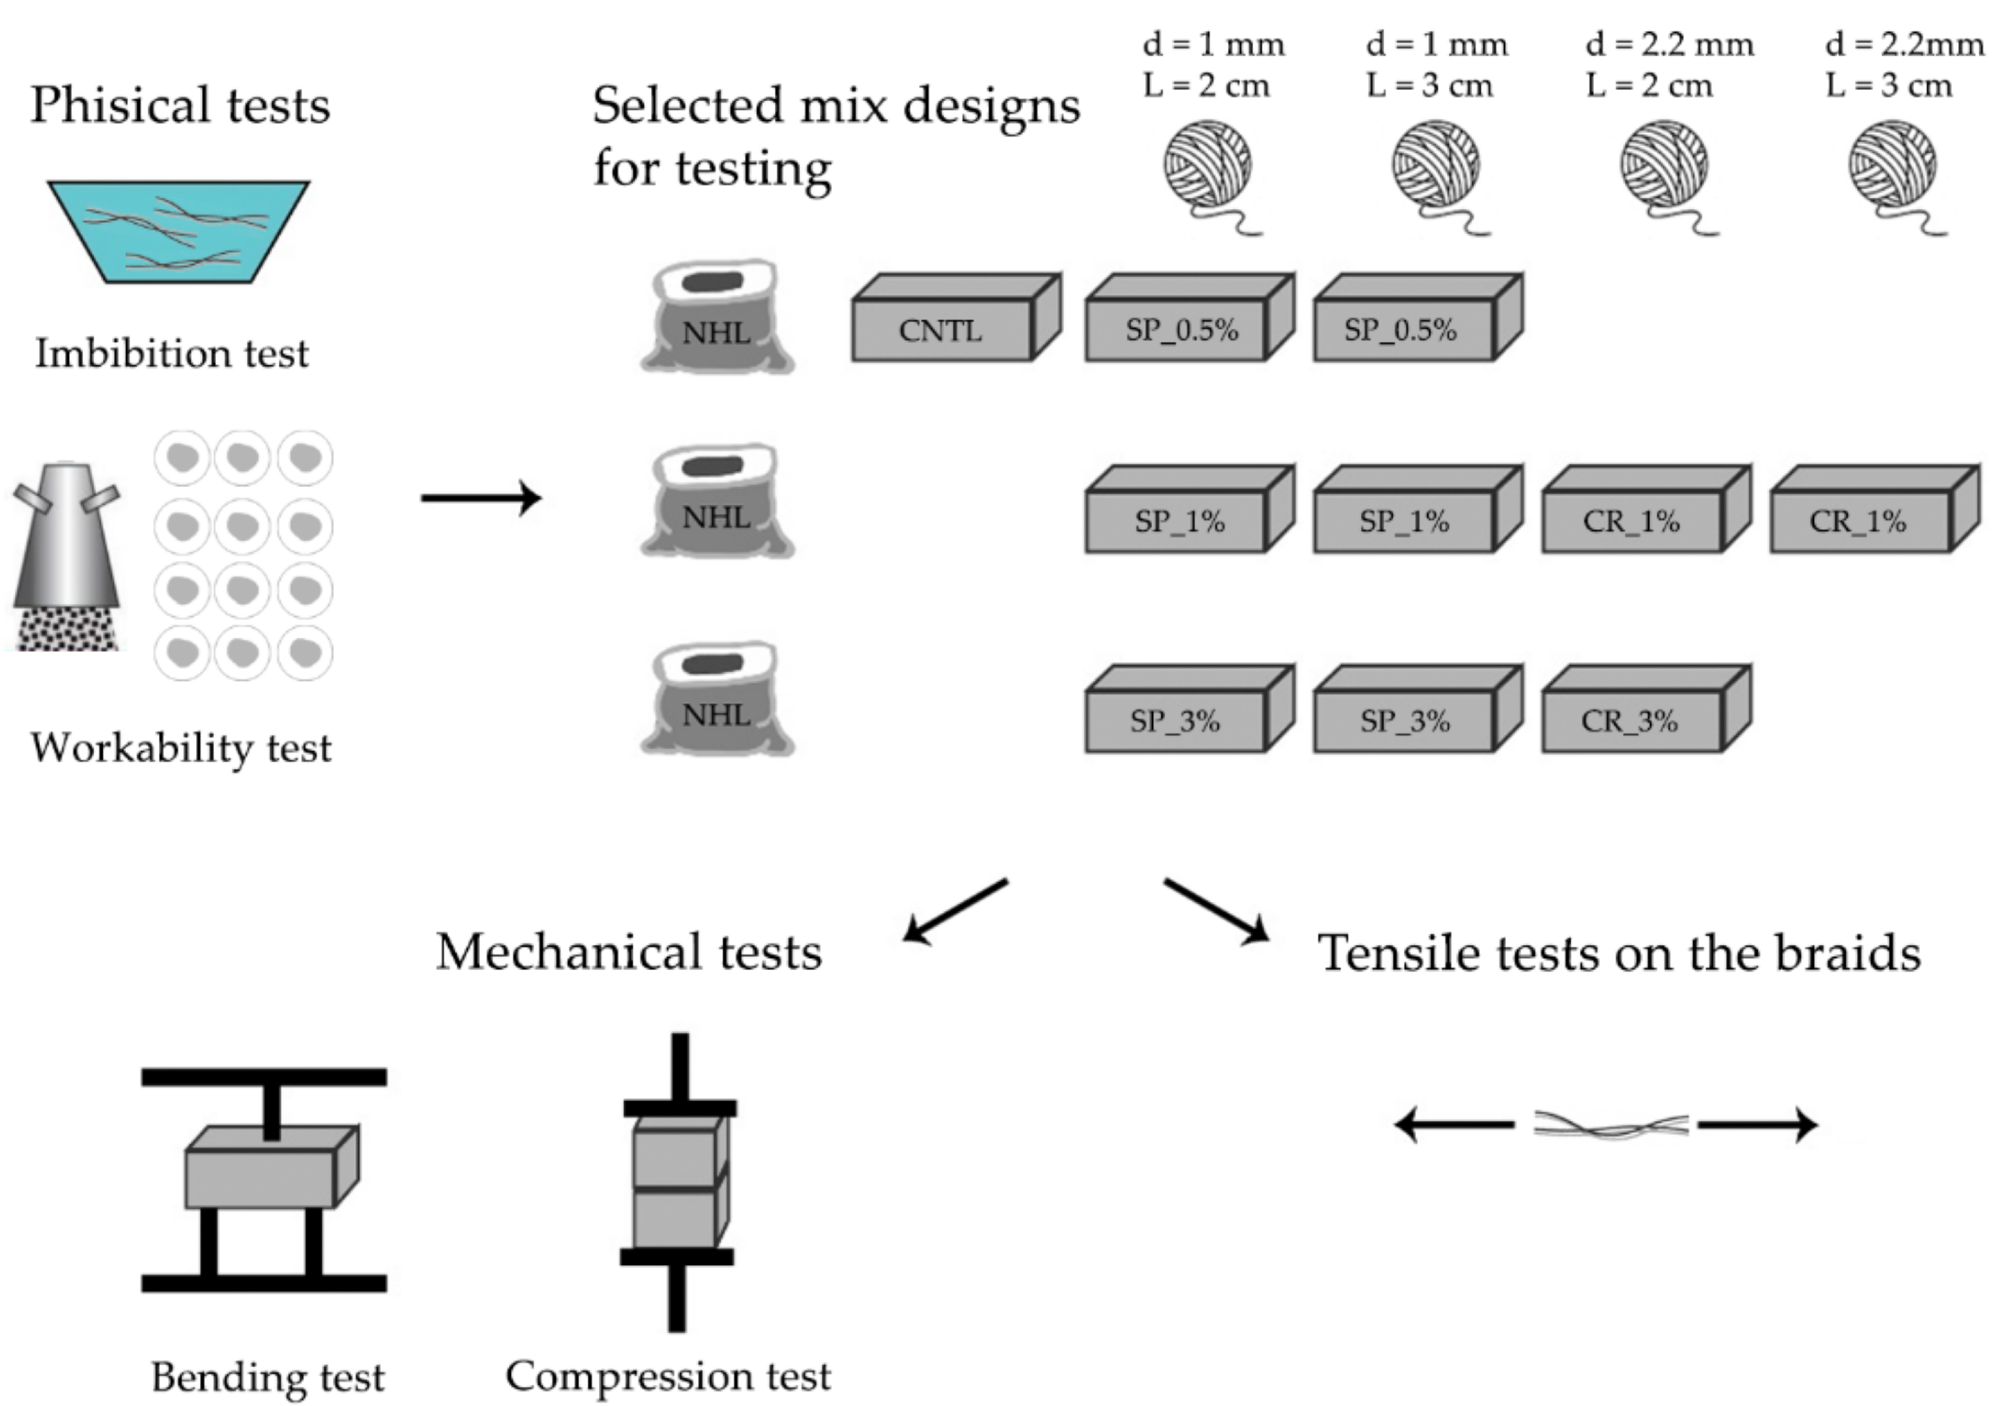
Figure 1. Overview of the experimental setup. Image Credit: Dovino, et al., 2022
The Kerakoll Company’s BIOCALCE® premixed for plasters is used to organize the specimens. It is a Natural Hydraulic Lime (NHL 3.5) with characteristics defined in accordance with EN 459-1.
Figure 2 shows the technical specifications of the eco-friendly natural mortar that was used.
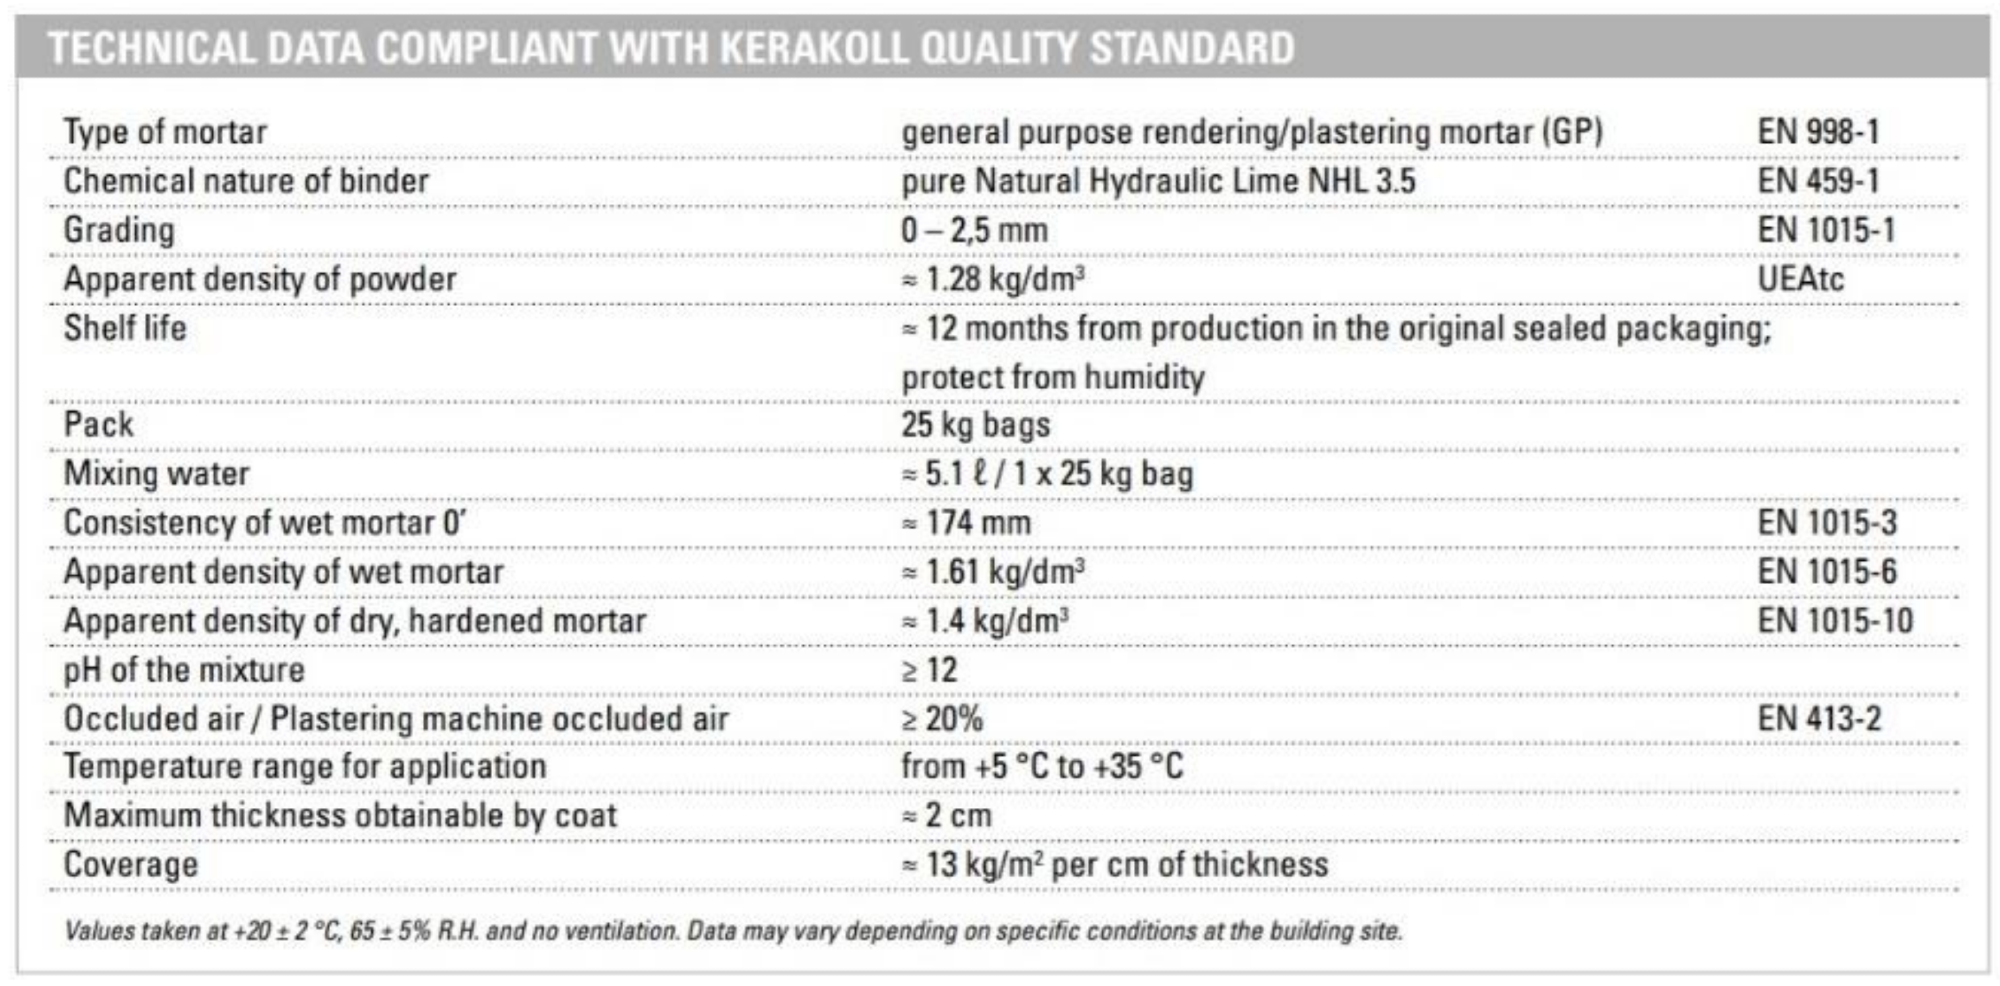
Figure 2. Characteristics of the BIOCALCE® product manufactured by the Kerakoll company. Image Credit: Dovino, et al., 2022
The reinforcement fibers are hemp braids grown in Italy and organized in a discontinuous pattern in the blend. Figure 3 depicts the two braid variants used, with diameters (d) of 1 mm and 2.2 mm, respectively.
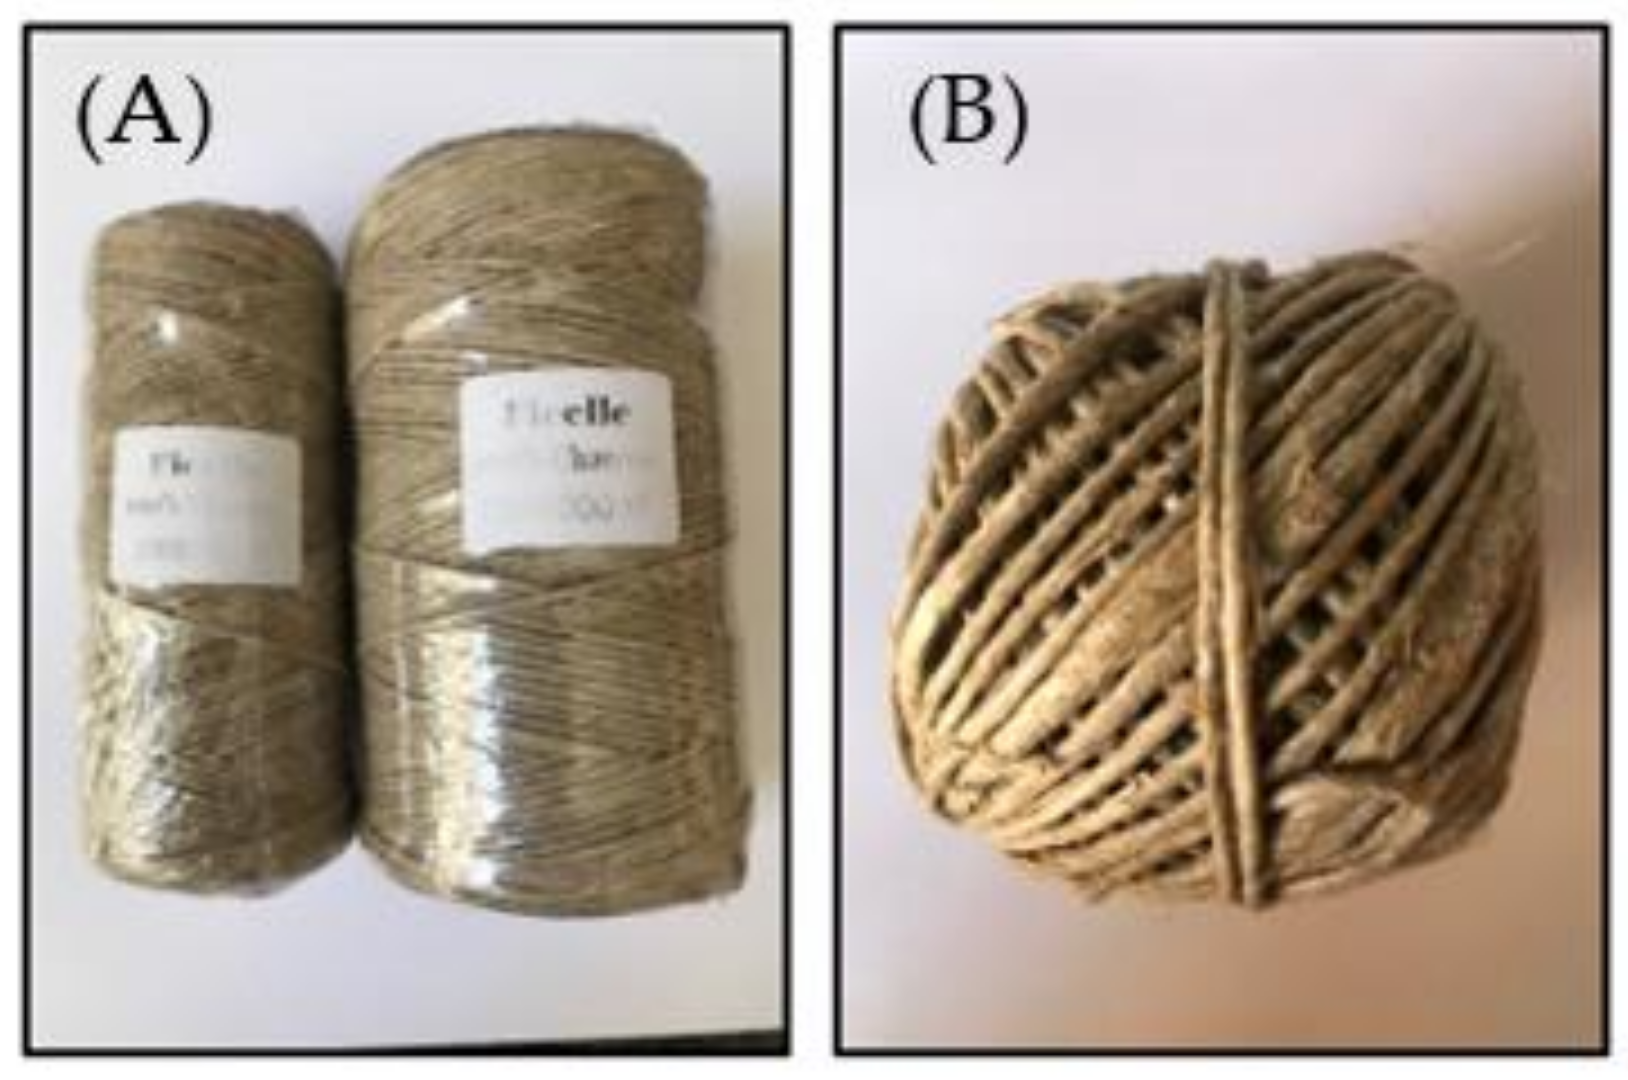
Figure 3. Hemp braids with diameter of 1 mm (A) and 2.2 mm (B). Image Credit: Dovino, et al., 2022
Methodology
The amount of water to be added to the mixture is estimated first by determining the degree of moisture absorption of the braids.
The amount of water absorbed is determined. Tables 1 and 2 show the initial and final weights, difference, and percentage of water determined for hemp braids with lengths of 1 mm and diameters of 2.2 mm, respectively.
Table 1. Water absorbed by 1 mm hemp braids. Source: Dovino, et al., 2022
| Day |
Initial
Weight
(g) |
Fiber
Length
(cm) |
Fiber
Diameter
(mm) |
Final
Weight (g) |
ΔWeight
Fiber (g) |
ΔWeight
H2O (%) |
| 1 |
0.9 |
2 |
1 |
1.70 |
0.8 |
88.89 |
| 2 |
0.9 |
3 |
1 |
1.80 |
0.9 |
100.00 |
| 3 |
0.9 |
4 |
1 |
1.88 |
0.98 |
108.89 |
| 4 |
0.9 |
5 |
1 |
1.94 |
1.04 |
115.56 |
| 5 |
0.9 |
6 |
1 |
1.97 |
1.07 |
118.89 |
| 6 |
0.9 |
2 |
1 |
1.97 |
1.07 |
118.89 |
Table 2. Water absorbed by 2.2 mm hemp braids. Source: Dovino, et al., 2022
| Day |
Initial
Weight
(g) |
Fiber
Length
(cm) |
Fiber
Diameter
(mm) |
Final
Weight
(g) |
ΔWeight
Fiber
(g) |
ΔWeight
H2O (%) |
| 1 |
4.92 |
2 |
2.2 |
10.35 |
5.43 |
110.37 |
| 2 |
4.92 |
2 |
2.2 |
10.66 |
5.74 |
116.67 |
| 3 |
4.92 |
2 |
2.2 |
10.85 |
5.93 |
120.53 |
| 4 |
4.92 |
2 |
2.2 |
10.95 |
6.03 |
122.56 |
| 5 |
4.92 |
2 |
2.2 |
10.98 |
6.06 |
123.17 |
| 6 |
4.92 |
2 |
2.2 |
10.98 |
6.06 |
123.17 |
Figure 4 depicts the saturation curves produced on braids with two diameters (1 mm and 2.2 mm) after 6 days of absorption.
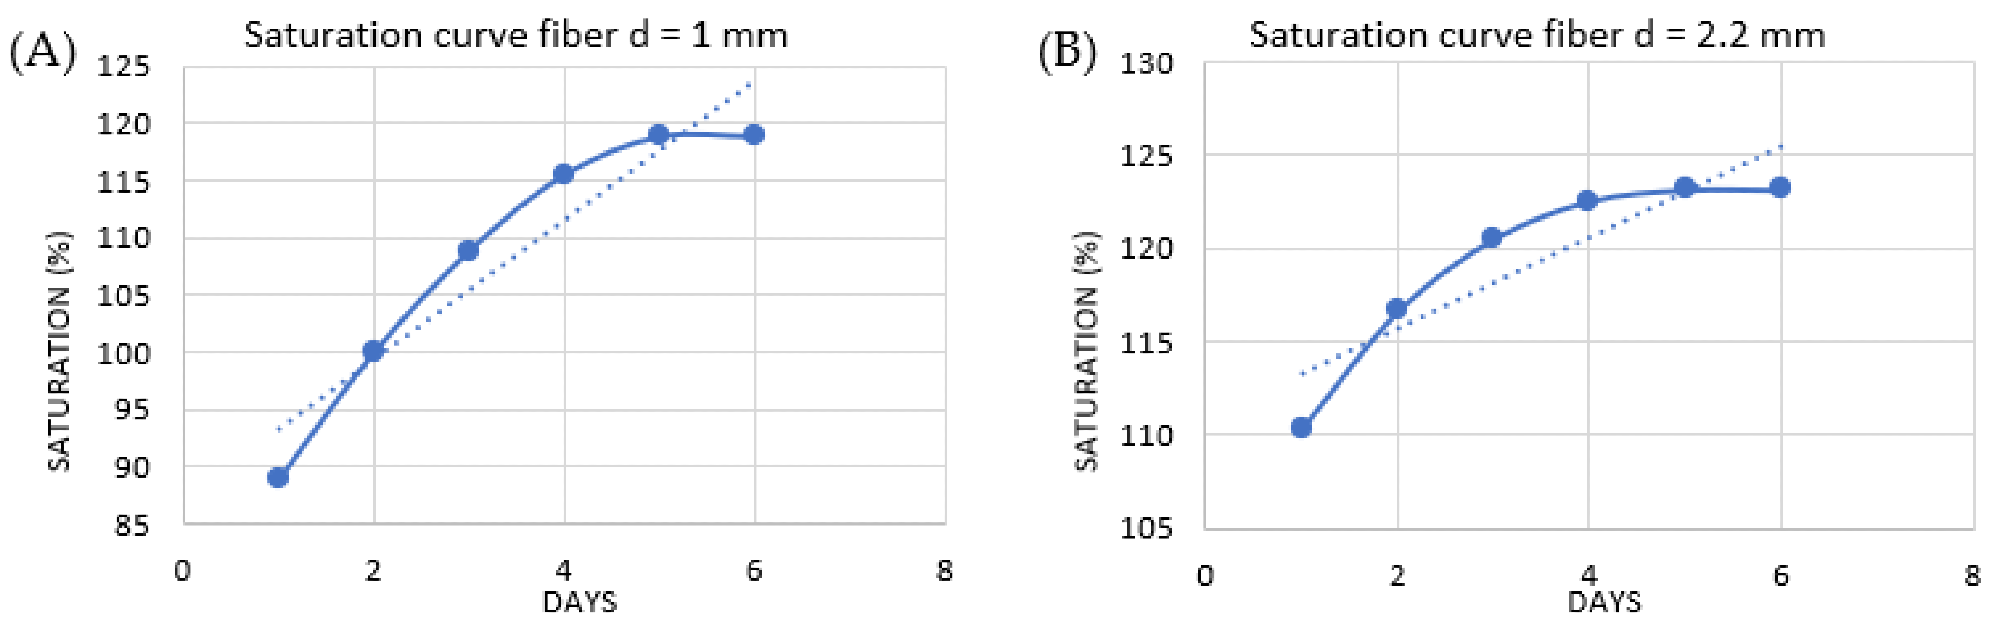
Figure 4. Saturation curves of hemp braids with diameter of 1 mm (A) and 2.2 mm (B). Image Credit: Dovino, et al., 2022
Among the numerous possible test methods, the performance of the mixture is measured using a shaking table in this case. The results of the workability tests on the examined mixtures are reported in Table 3 and Figure 5.
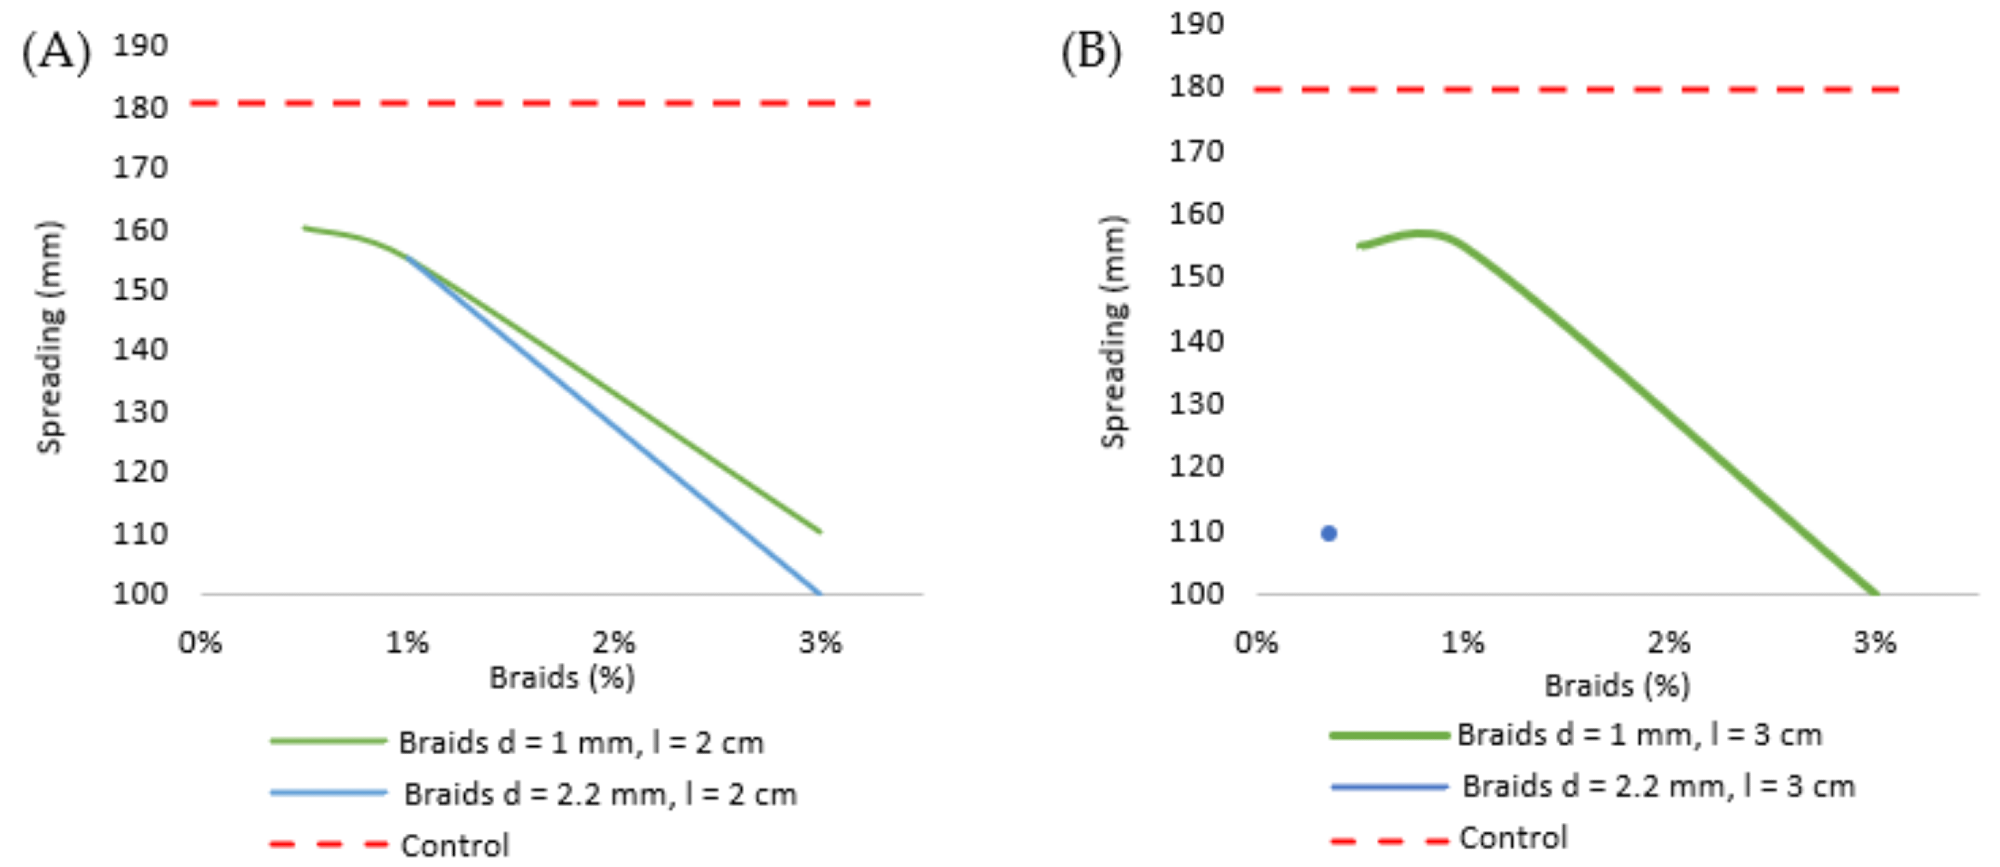
Figure 5. Workability curves for fibers with length of 20 mm (A) and 30 mm (B). Image Credit: Dovino, et al., 2022
Table 3. Spread values of control specimens and specimens supplemented with fibers. Source: Dovino, et al., 2022
| Acronym |
Braid Length (mm) |
Diameter (mm) |
Braid Amount (%) |
Spread (mm) |
| Control |
/ |
/ |
/ |
180 |
| SP_01 |
20 |
1 |
0.5 |
160 |
| SP_02 |
20 |
1 |
1 |
155 |
| SP_03 |
20 |
1 |
3 |
110 |
| SP_04 |
30 |
1 |
0.5 |
155 |
| SP_05 |
30 |
1 |
1 |
155 |
| SP_06 |
30 |
1 |
3 |
100 |
| CR_01 |
20 |
2.2 |
1 |
155 |
| CR_02 |
20 |
2.2 |
3 |
100 |
| CR_03 |
30 |
2.2 |
1 |
100 |
Once the optimal water/lime ratio is determined, the components are balanced by mixing lime and gradually incorporating hemp fibers into the mixture, as shown in Figure 6.
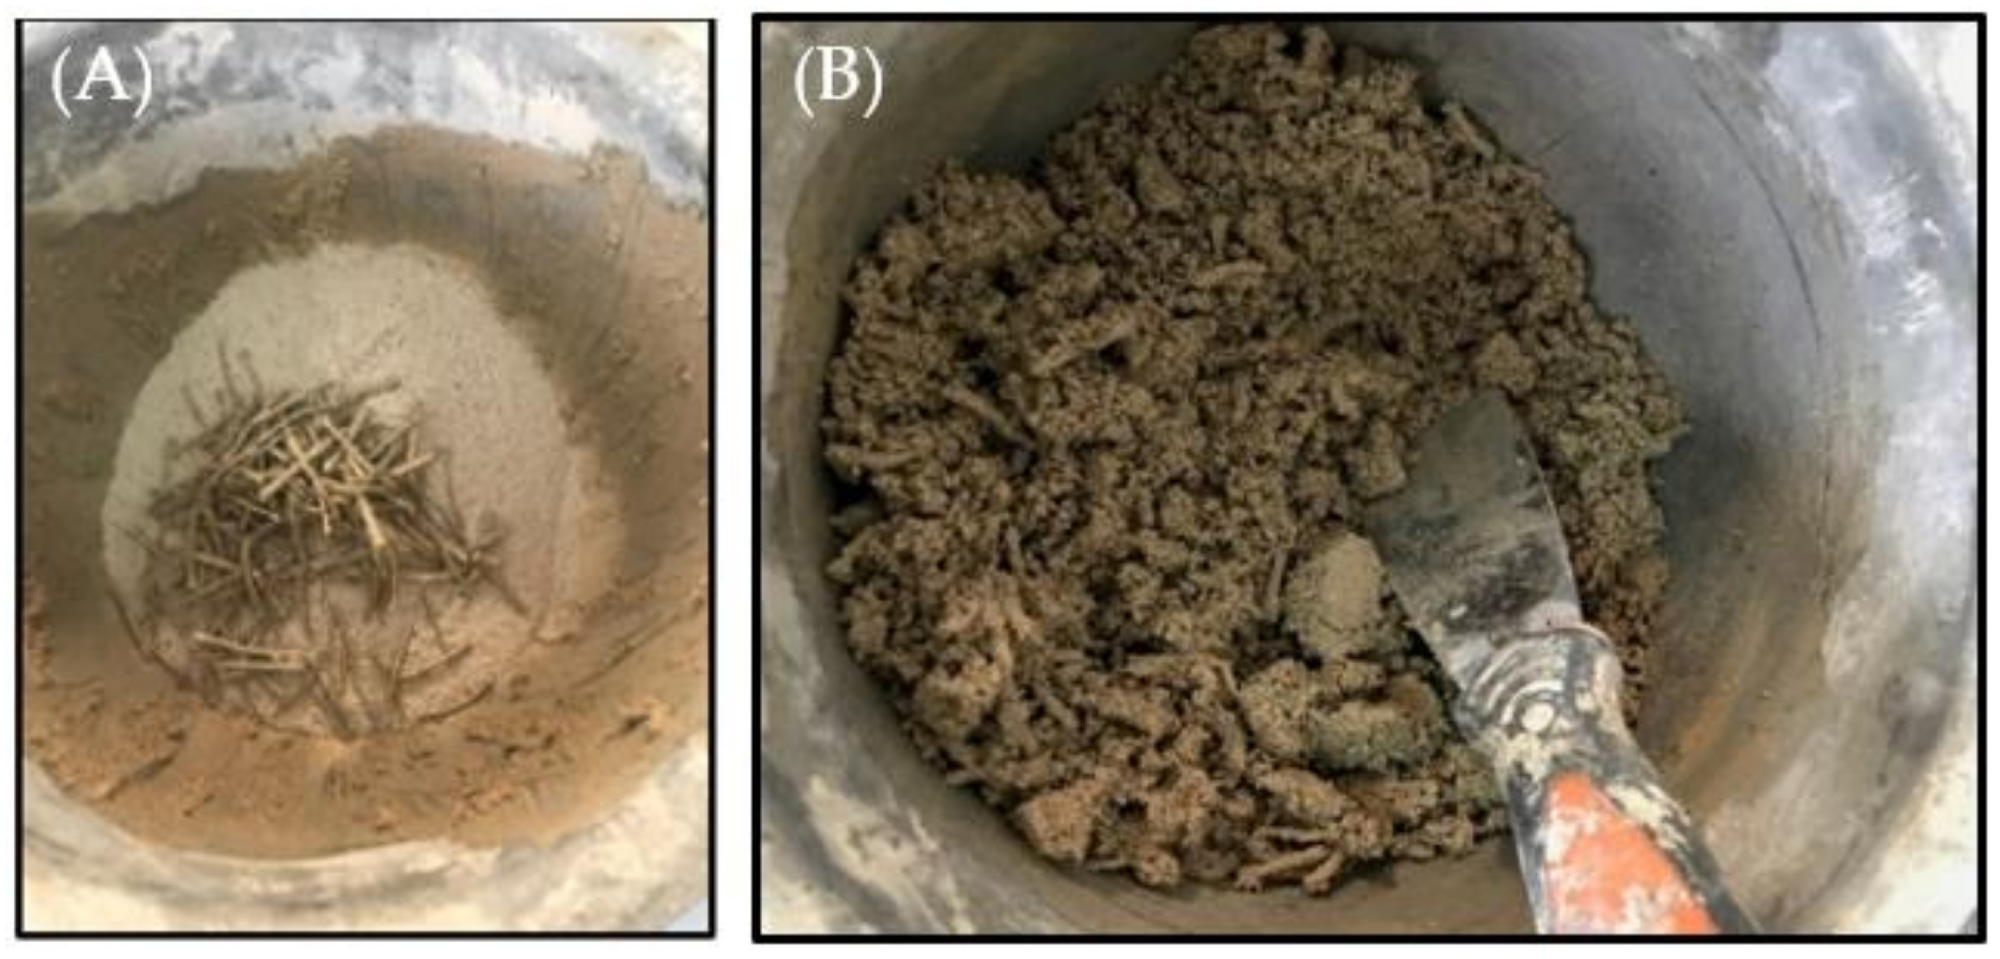
Figure 6. Example of a 3% fiber-reinforced lime mortar before (A) and after (B) blending. Image Credit: Dovino, et al., 2022
A total of 27 specimens (Figure 7) with varying percentages of fiber were equipped. Three samples were made for each variable combination.
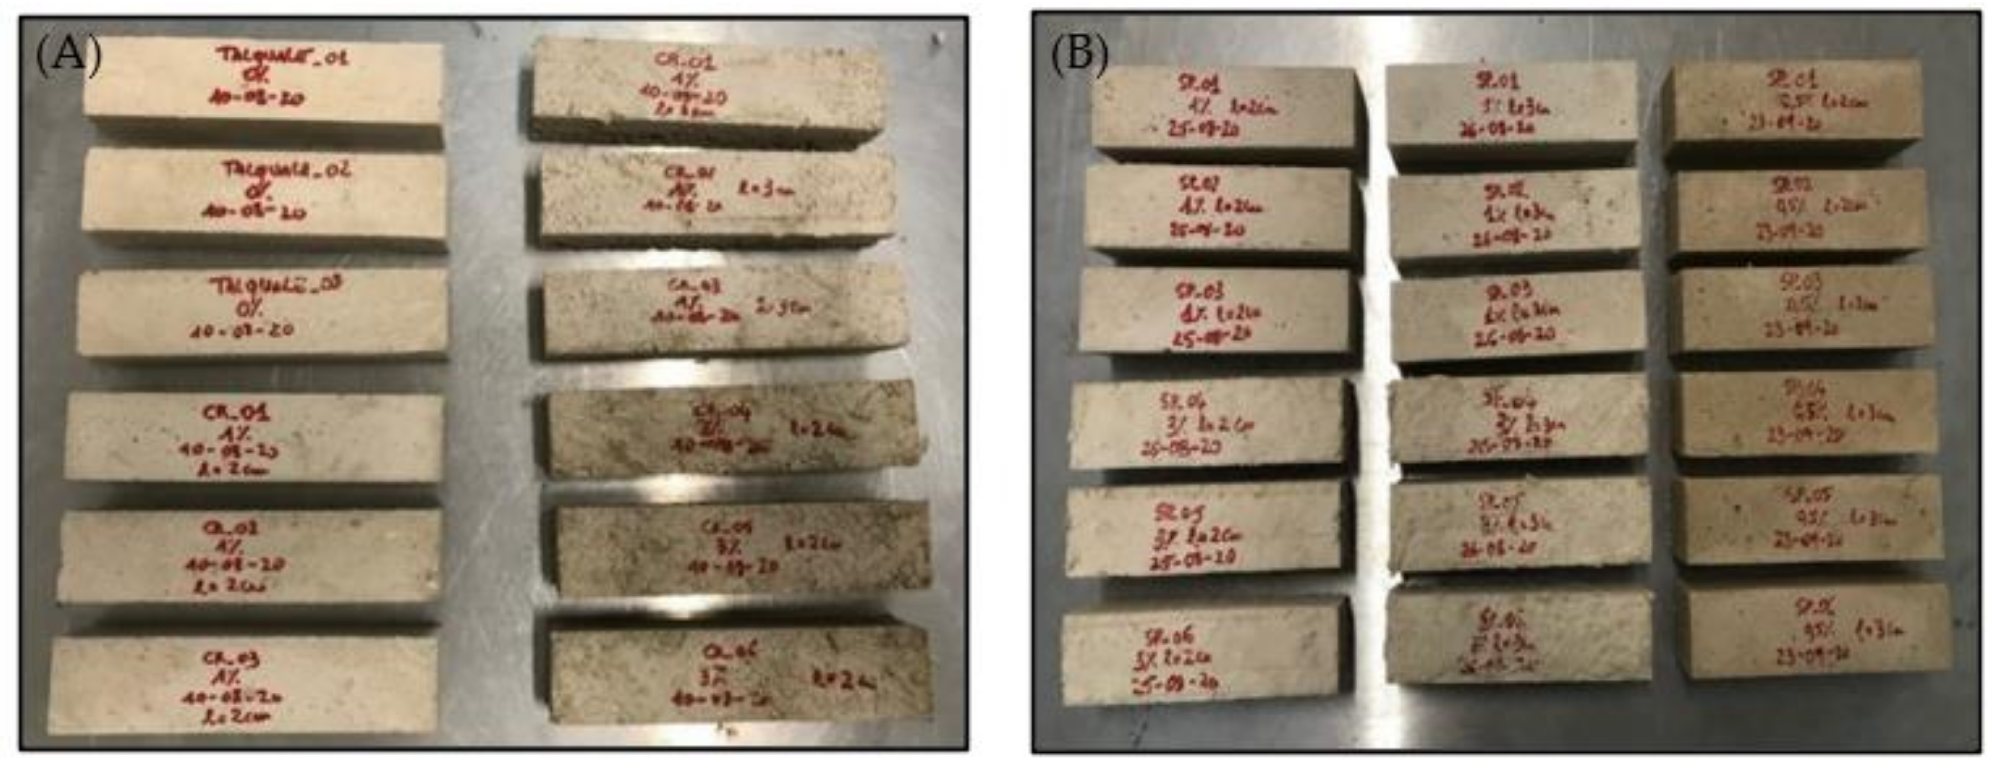
Figure 7. Overview of the control, d = 2.2 mm braids (A) and d = 1 mm braids (B) samples. Image Credit: Dovino, et al., 2022
After 28 days of mortar curing, the specimens were monitored with a gauge to evaluate any shrinkage.
With the exception of a few isolated cases, no discernible variations in dimensions were found. The results are shown in Tables 6 and 7.
Table 6. Measurement of control specimens after curing. Source: Dovino, et al., 2022
| Acronym |
Base (mm) |
Height (mm) |
Depth (mm) |
| CNTL_01 |
40 |
40 |
160 |
| CNTL_02 |
40 |
40 |
160 |
| CNTL_03 |
40 |
40 |
160 |
Table 7. Measurement of specimens after curing. Source: Dovino, et al., 2022
| Acronym |
Base (mm) |
Height (mm) |
Depth (mm) |
| SP_01, 0.5%, l = 2 cm, d = 1 |
40 |
40 |
160 |
| SP_02, 0.5%, l = 2 cm, d = 1 |
40 |
40 |
159.5 |
| SP_03, 0.5%, l = 2 cm, d = 1 |
40 |
40 |
160 |
| SP_04, 0.5%, l = 3 cm, d = 1 |
41 |
40 |
160 |
| SP_05, 0.5%, l = 3 cm, d = 1 |
40 |
41 |
160 |
| SP_06, 0.5%, l = 3 cm, d = 1 |
40 |
41 |
160 |
| SP_01, 1%, l = 2 cm, d = 1 |
40 |
40 |
160.5 |
| SP_02, 1%, l = 2 cm, d = 1 |
40 |
41 |
160.6 |
| SP_03, 1%, l = 2 cm, d = 1 |
40 |
40.5 |
160 |
| SP_04, 3%, l = 2 cm, d = 1 |
40 |
41 |
160 |
| SP_05, 3%, l = 2 cm, d = 1 |
40 |
41 |
160 |
| SP_06, 3%, l = 2 cm, d = 1 |
40 |
41 |
160 |
| SP_01, 1%, l = 3 cm, d = 1 |
40 |
40.5 |
160 |
| SP_02, 1%, l = 3 cm, d = 1 |
40 |
40.5 |
159.5 |
| SP_03, 1%, l = 3 cm, d = 1 |
40 |
40 |
159.5 |
| SP_04, 3%, l = 3 cm, d = 1 |
40 |
41 |
160 |
| SP_05, 3%, l = 3 cm, d = 1 |
41 |
40 |
159.5 |
| SP_06, 3%, l = 3 cm, d = 1 |
41.5 |
40 |
159.5 |
| CR_01, 1%, l = 2 cm, d = 2.2 |
40 |
40 |
159.5 |
| CR_02, 1%, l = 2 cm, d = 2.2 |
40 |
40.5 |
160 |
| CR_03, 1%, l = 2 cm, d = 2.2 |
40 |
40 |
159.5 |
| CR_04, 3%, l = 2 cm, d = 2.2 |
40 |
41 |
160 |
| CR_05, 3%, l = 2 cm, d = 2.2 |
40 |
40.5 |
160 |
| CR_06, 3%, l = 2 cm, d = 2.2 |
40 |
41 |
160 |
| CR_01 1%, l = 3 cm, d = 2.2 |
40 |
41 |
160 |
| CR_02, 1%, l = 3 cm, d = 2.2 |
40 |
40.5 |
160 |
| CR_03, 1%, l = 3 cm, d = 2.2 |
40 |
40.5 |
160 |
The specimens were put through a three-point bending test after curing. The test involved applying a concentrated force to the specimen in the middle, which was restrained at the endpoints by two cylindrical supports. The specimen was exactly aligned inside the testing machine, with spacing between the supports of 100 mm.
Results and Discussion
The trends of the maximum, lowest, and average stresses of the reinforced specimens are provided in different fiber percentages, diameters, and lengths of the examined hemp braids to contrast the findings of the bending tests on the fiber-reinforced lime mortar with others on the regular specimens (Figure 14).
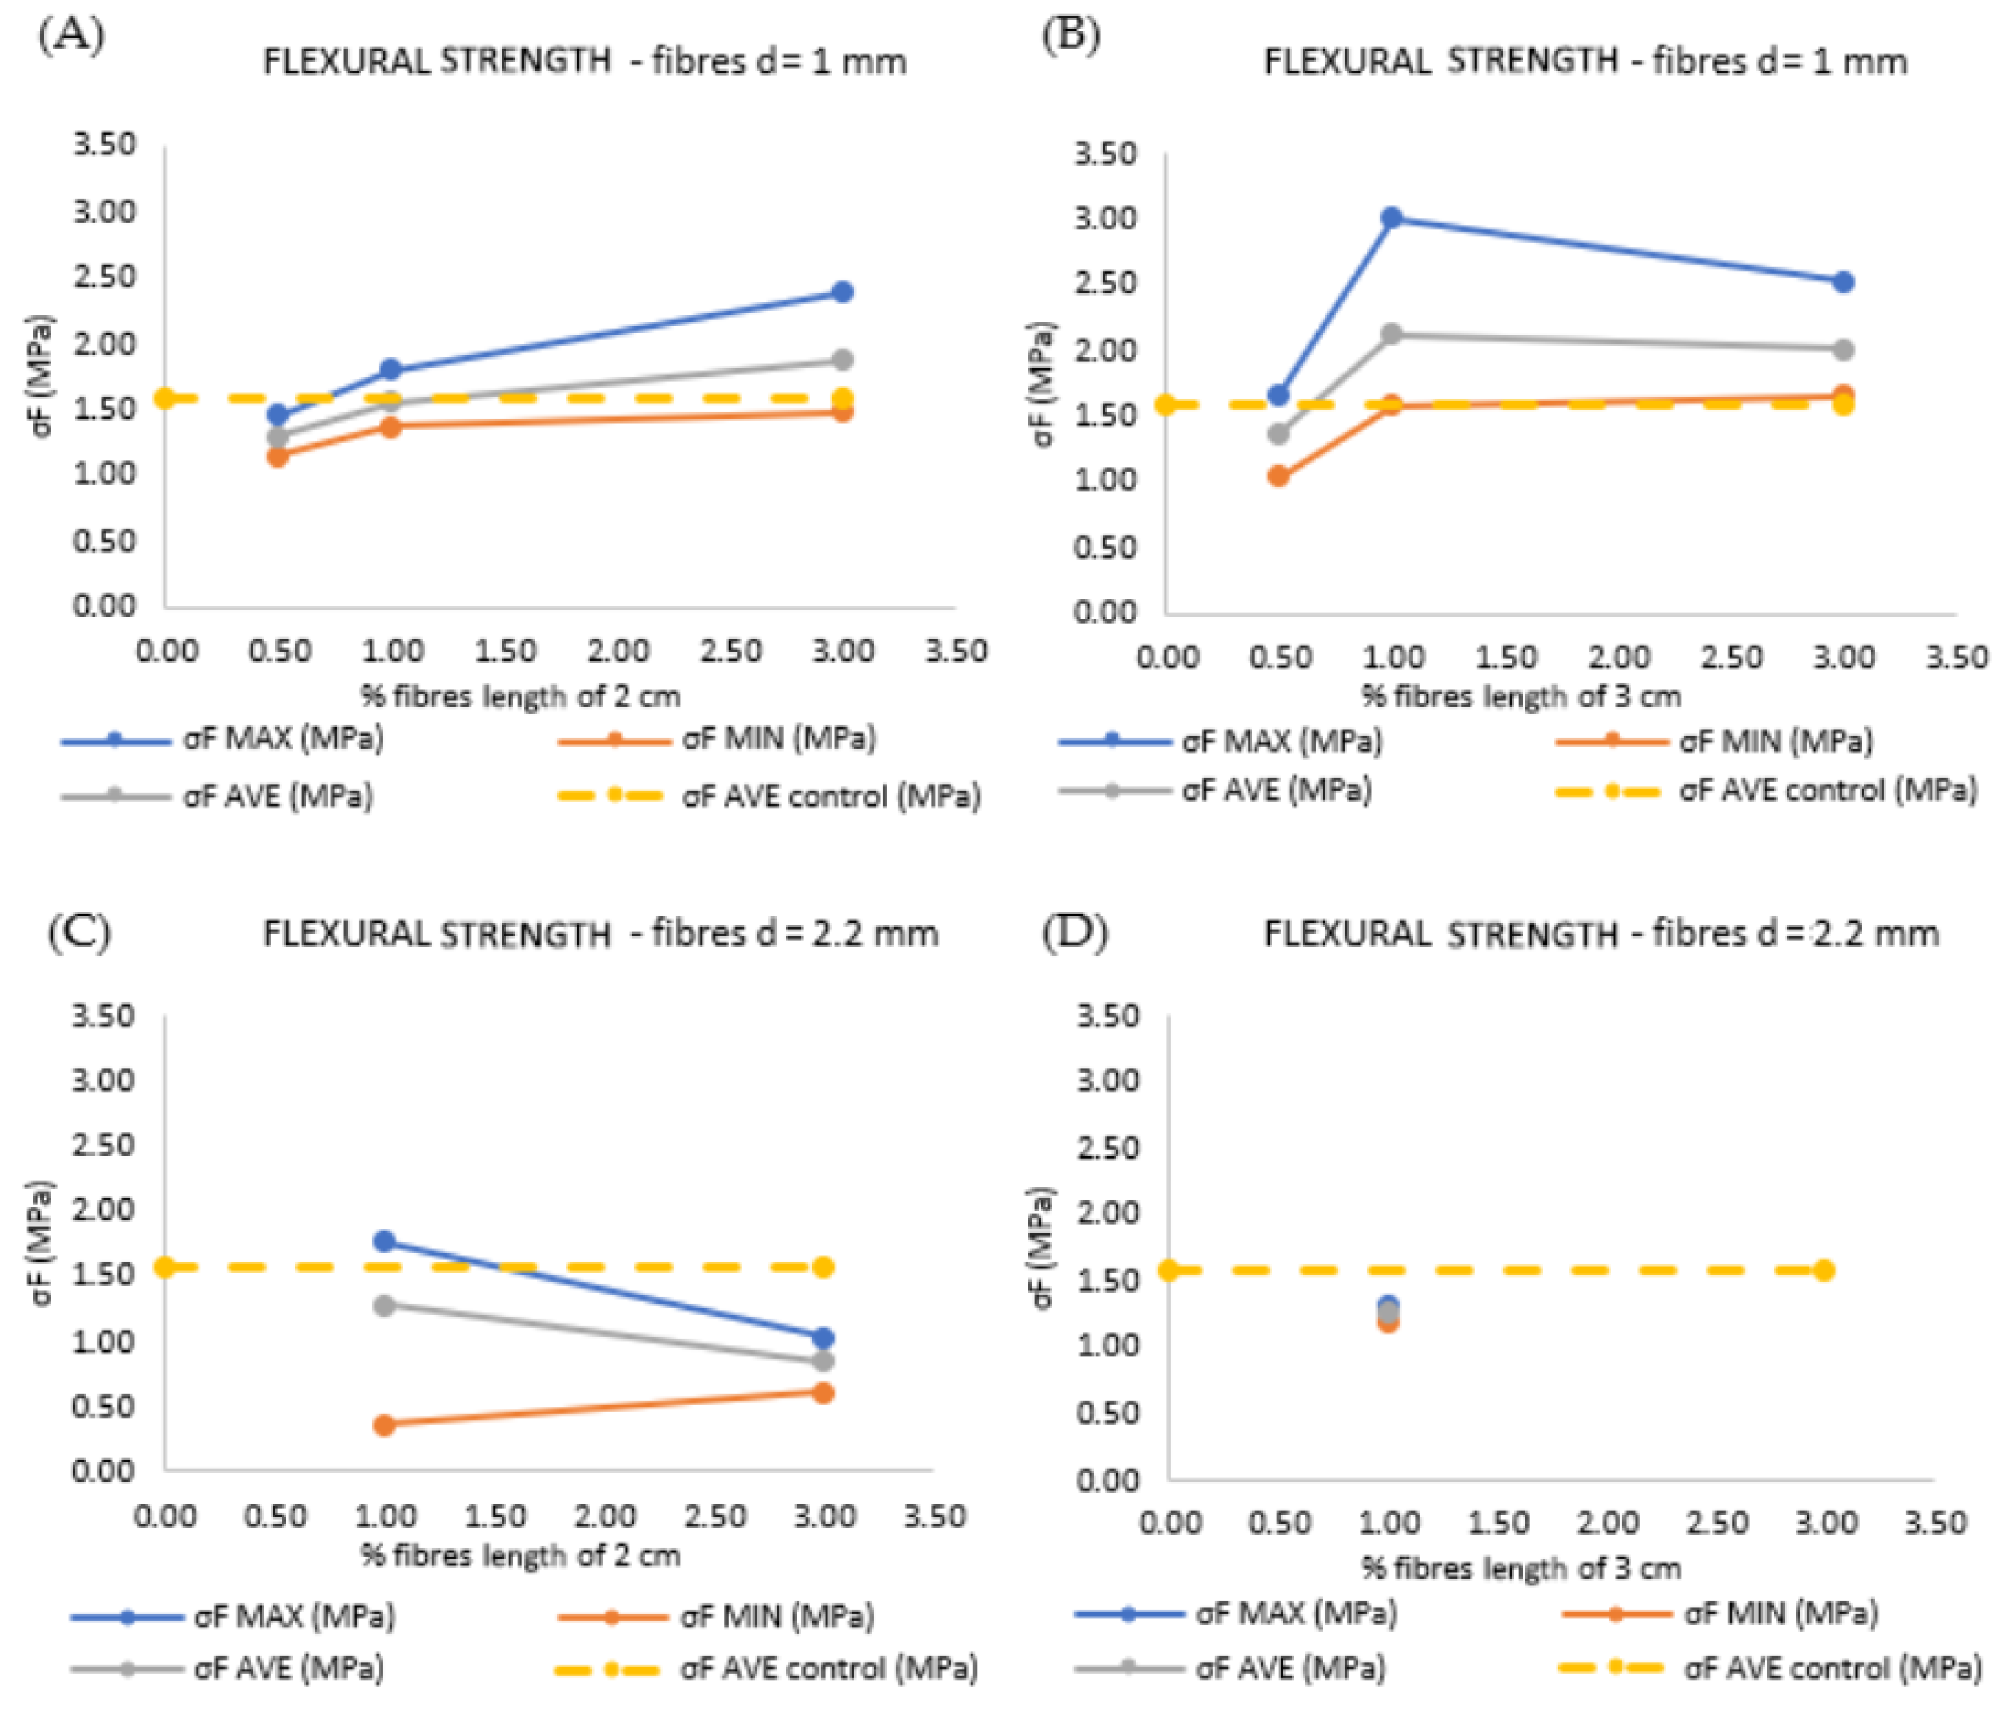
Figure 14. Variation of the flexural resistance along with increasing of fiber percentage: 1 mm fibers with lengths of 2 cm (A) and 3 cm (B) and 2.2 mm fibers with lengths of 2 cm (C) and 3 cm (D). Image Credit: Dovino, et al., 2022
The average values of bending resistance for both braid lengths examined are shown in the histograms in Figure 15. According to these findings, braids with a length of 2 cm give a mean bending stress reduction of around 13% when compared to the control specimen.
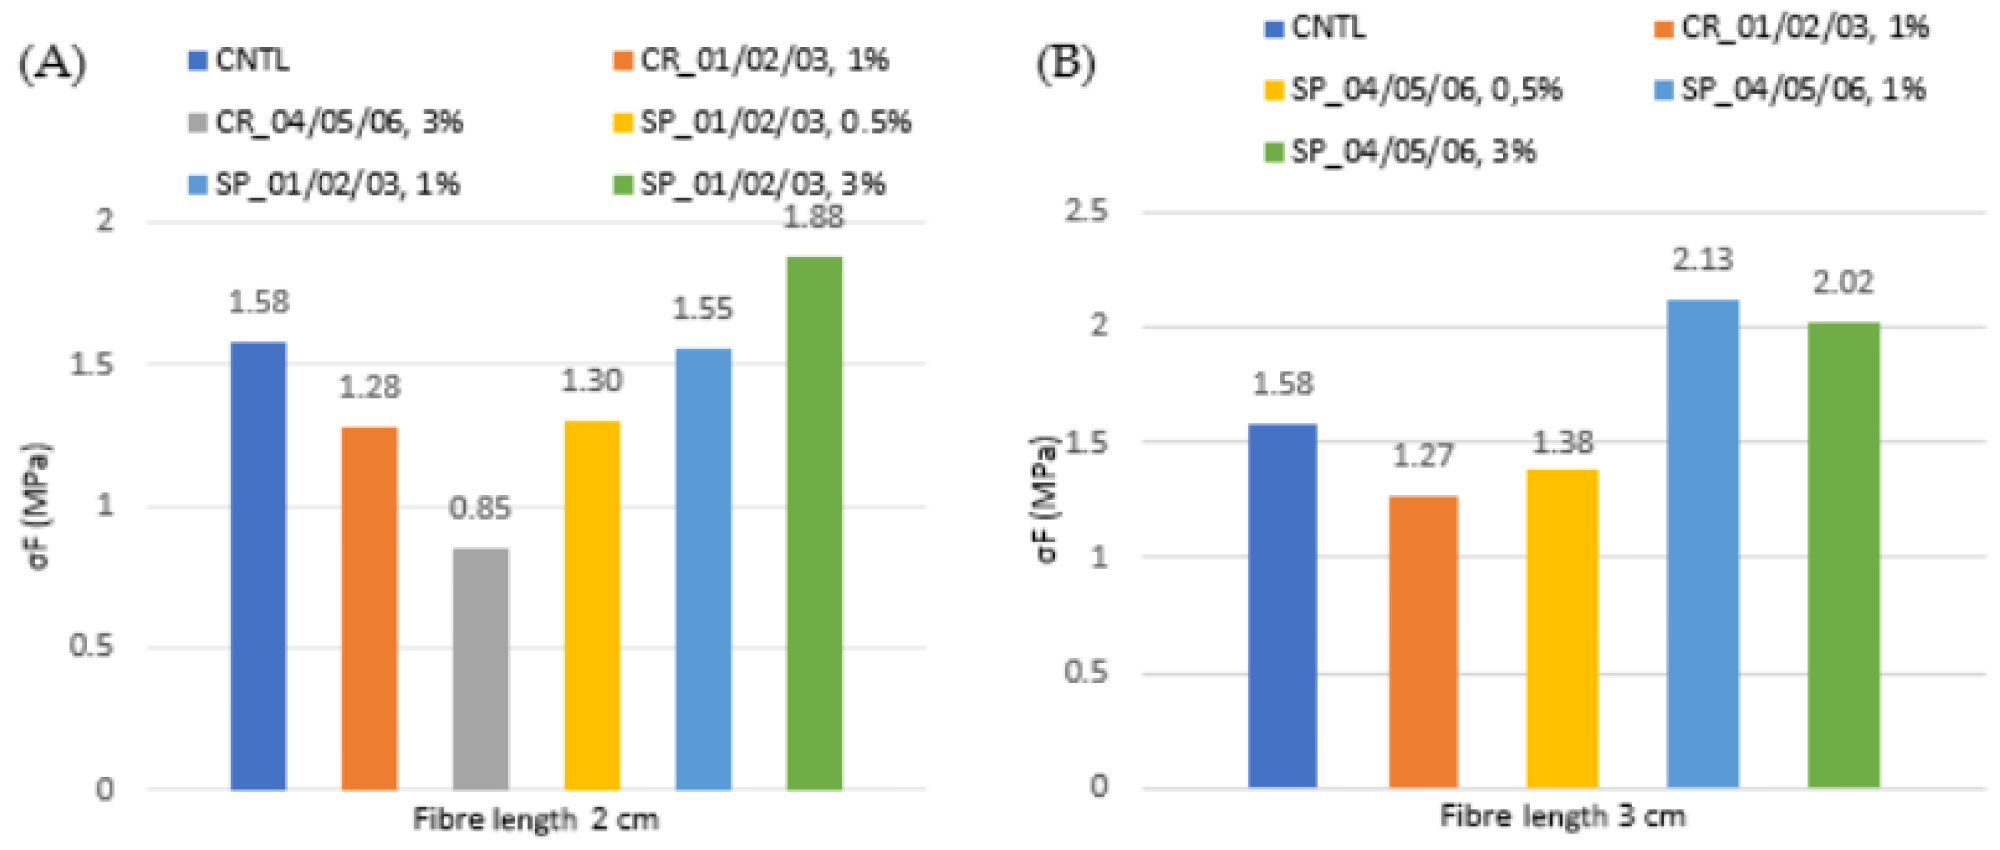
Figure 15. Histograms of average values of bending resistance for braids with lengths of 2 cm (A) and 3 cm (B). Image Credit: Dovino, et al., 2022
All specimens, such as the two halves emerging from the breaking of those exposed to bending tests, are subjected to compressive tests. The results are presented in Tables 10 and 11.
Table 10. Compressive test results on control specimens. The average values (AVE) are reported with the standard deviation (SD). Source: Dovino, et al., 2022
| Acronym |
N (kN) |
σC (MPa) |
AVE SD (MPa) |
δ (mm) |
AVE SD (mm) |
| CNTL _01 |
11.14 |
6.96 |
6.04
0.70 |
0.464 |
0.64
0.23 |
| CNTL _02 |
9.83 |
6.14 |
0.652 |
| CNTL _03 |
8.40 |
5.25 |
1.019 |
Table 11. Compressive test results on fiber-reinforced specimens. The average values (AVE) are reported with the standard deviation (SD). Source: Dovino, et al., 2022
| Acronym |
N
(kN) |
σC
(MPa) |
AVE SD
(MPa) |
δ
(mm) |
AVE SD
(mm) |
| SP_01, 0.5%, l = 2 cm, d = 1 |
6.724 |
4.203 |
4.56
0.26 |
0.65 |
0.73
0.11 |
| SP_02, 0.5%, l = 2 cm, d = 1 |
7.547 |
4.717 |
0.90 |
| SP_03, 0.5%, l = 2 cm, d = 1 |
7.678 |
4.799 |
0.69 |
| SP_04, 0.5%, l = 3 cm, d = 1 |
8.213 |
5.133 |
4.60
0.55 |
0.97 |
0.79
0.12 |
| SP_05, 0.5%, l = 3 cm, d = 1 |
6.224 |
3.890 |
0.74 |
| SP_06, 0.5%, l = 3 cm, d = 1 |
7.972 |
4.983 |
0.70 |
| SP_01, 1%, l = 2 cm, d = 1 |
5.840 |
3.650 |
3.47
1.03 |
1.89 |
0.77
0.61 |
| SP_02, 1%, l = 2 cm, d = 1 |
8.103 |
5.064 |
0.76 |
| SP_03, 1%, l = 2 cm, d = 1 |
4.074 |
2.546 |
0.49 |
| SP_04, 3%, l = 2 cm, d = 1 |
5.361 |
3.351 |
3.54
0.19 |
0.45 |
0.66
0.20 |
| SP_05, 3%, l = 2 cm, d = 1 |
5.585 |
3.491 |
0.82 |
| SP_06, 3%, l = 2 cm, d = 1 |
6.105 |
3.816 |
0.90 |
| SP_01, 1%, l = 3 cm, d = 1 |
7.381 |
4.613 |
4.24
0.27 |
0.58 |
0.78
0.20 |
| SP_02, 1%, l = 3 cm, d = 1 |
6.307 |
3.942 |
0.87 |
| SP_03, 1%, l = 3 cm, d = 1 |
6.767 |
4.229 |
1.05 |
| SP_04, 3%, l = 3 cm, d = 1 |
5.502 |
3.439 |
3.35
0.11 |
0.84 |
0.74
0.08 |
| SP_05, 3%, l = 3 cm, d = 1 |
5.484 |
3.428 |
0.75 |
| SP_06, 3%, l = 3 cm, d = 1 |
5.112 |
3.195 |
0.65 |
| CR_01, 1%, l = 2 cm, d = 2.2 |
7.99 |
4.99 |
4.50
1.03 |
0.698 |
0.55
0.11 |
| CR_02, 1%, l = 2 cm, d = 2.2 |
5.41 |
3.38 |
0.438 |
| CR_03, 1%, l = 2 cm, d = 2.2 |
9.37 |
5.86 |
0.560 |
| CR_04, 3%, l = 2 cm, d = 2.2 |
3.33 |
2.08 |
2.60
0.57 |
0.705 |
0.68
0.14 |
| CR_05, 3%, l = 2 cm, d = 2.2 |
5.52 |
3.45 |
0.882 |
| CR_06, 3%, l = 2 cm, d = 2.2 |
4.15 |
2.60 |
0.537 |
| CR_01 1%, l = 3 cm, d = 2.2 |
4.73 |
2.96 |
3.66
0.75 |
0.681 |
0.91
0.30 |
| CR_02, 1%, l = 3 cm, d = 2.2 |
7.64 |
4.77 |
1.390 |
| CR_03, 1%, l = 3 cm, d = 2.2 |
5.89 |
3.68 |
0.913 |
The compressive test findings of the fiber-reinforced mortar are contrasted with those of standard specimens. For each diameter and length of examined braids, the graphs in Figure 19 illustrate the trends of the maximum, minimum, and mean stresses of the reinforced specimens as the proportion of fiber rises.
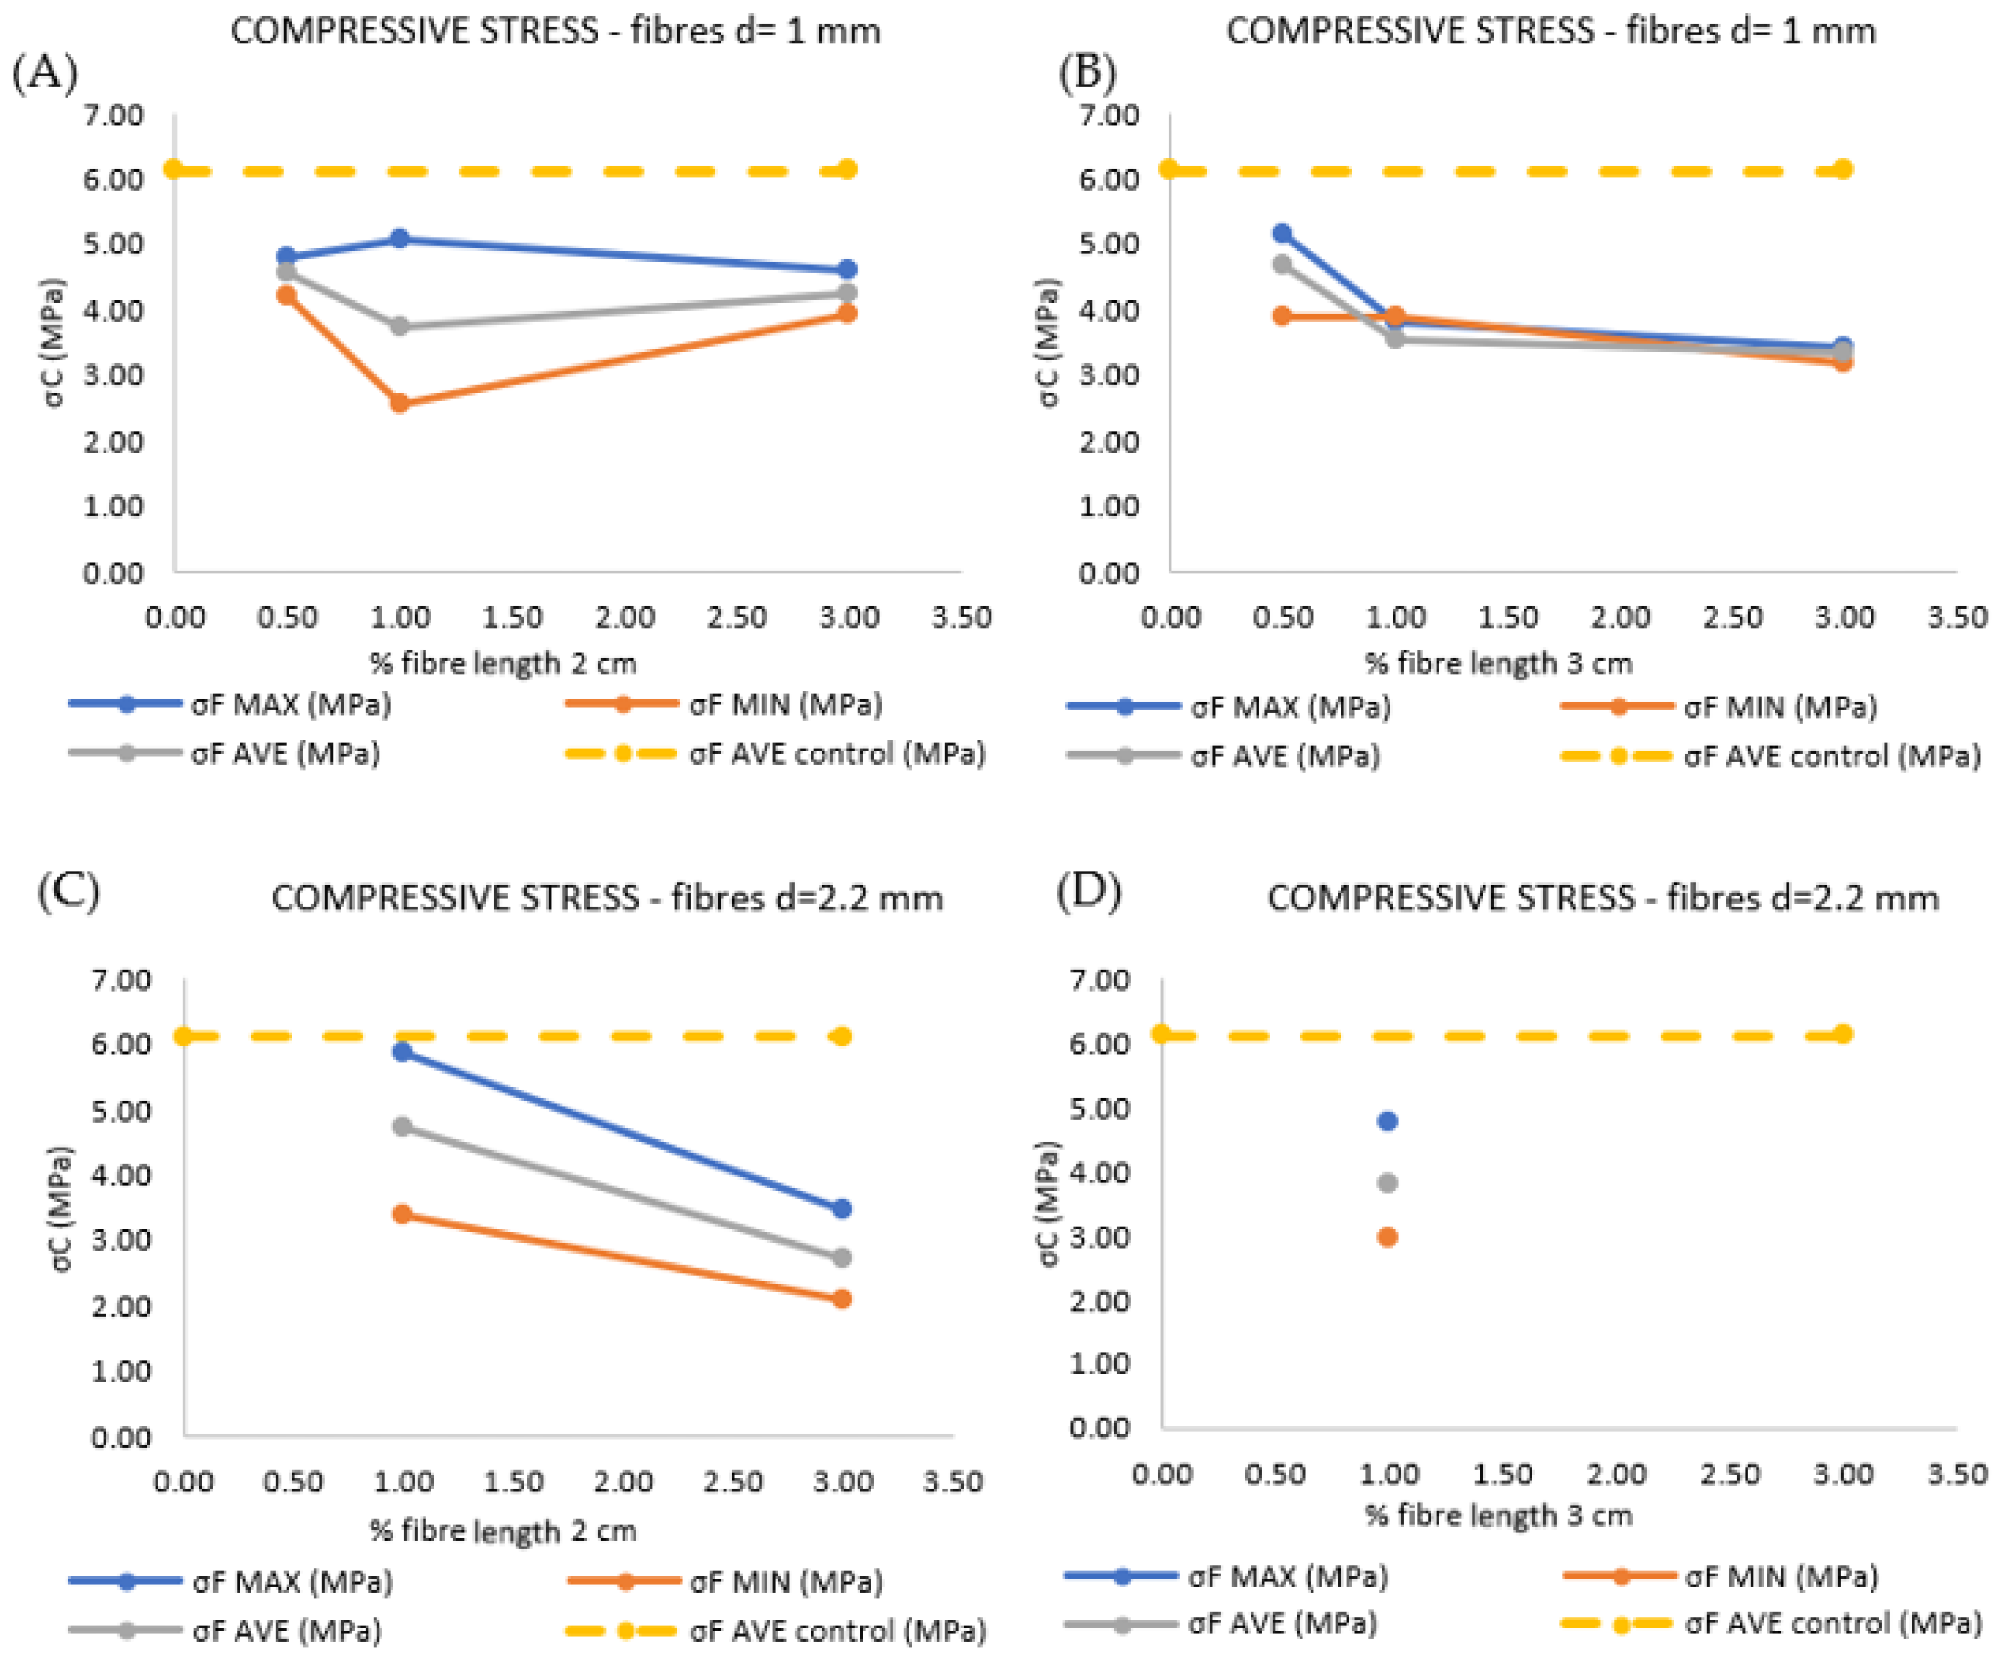
Figure 19. Variation of compressive strength with increasing fiber percentage: d = 1 mm fibers with lengths of 2 cm (A) and 3 cm (B) and d = 2.2 mm fibers with lengths of 2 cm (C) and 3 cm (D). Image Credit: Dovino, et al., 2022
Figure 20 represents the typical compressive strength values for both braid lengths studied in histograms.
Single threads are entwined in a helical pattern to form braid filaments (Figure 21). This structure is unique to hemp, and it improves shear resistance when compared to synthetic fibers like glass fiber bundles.
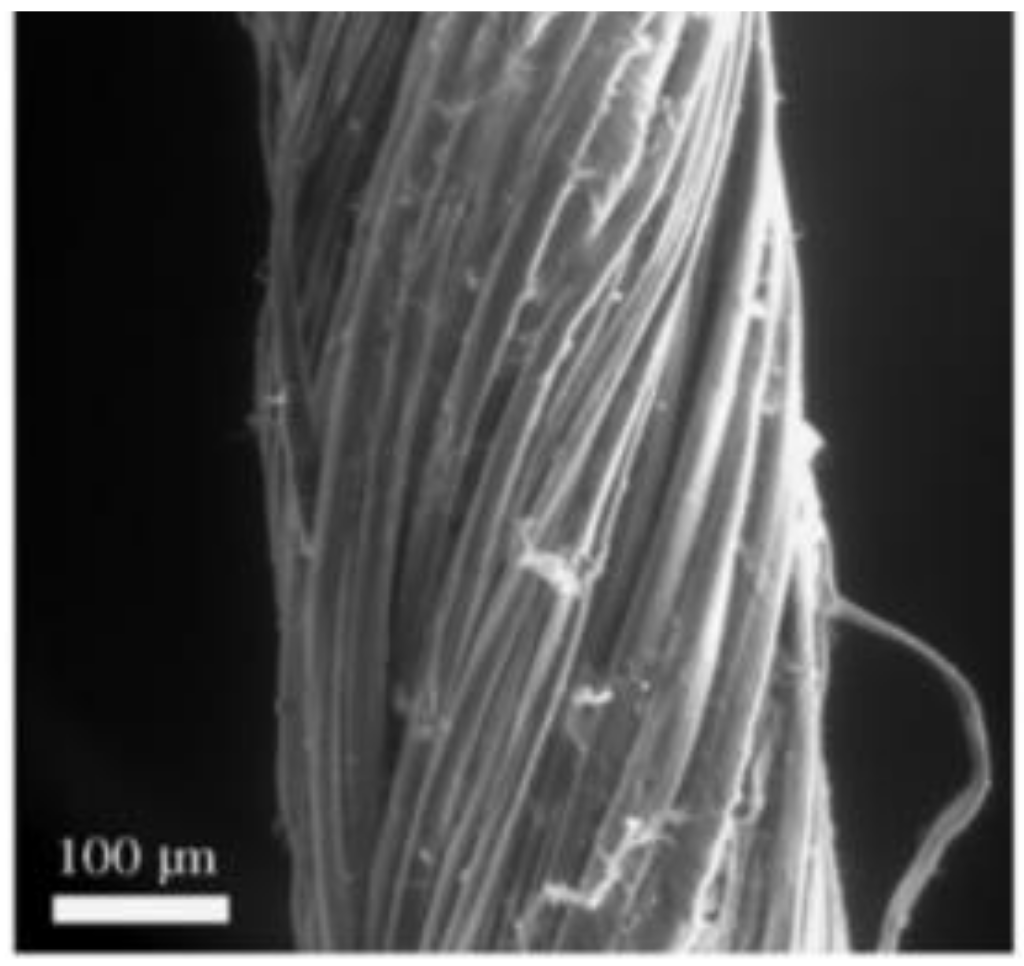
Figure 21. Electron microscope photo of the hemp yarn with focus on the twist angle of the individual microfibers. Image Credit: Dovino, et al., 2022
A unified machine with displacement control was used to conduct a unidirectional tensile test on braids with 4 distinct diameters (4 mm, 3 mm, 2.2 mm, and 1 mm) for a maximum of 12 samples (three for each diameter) (Figure 22).
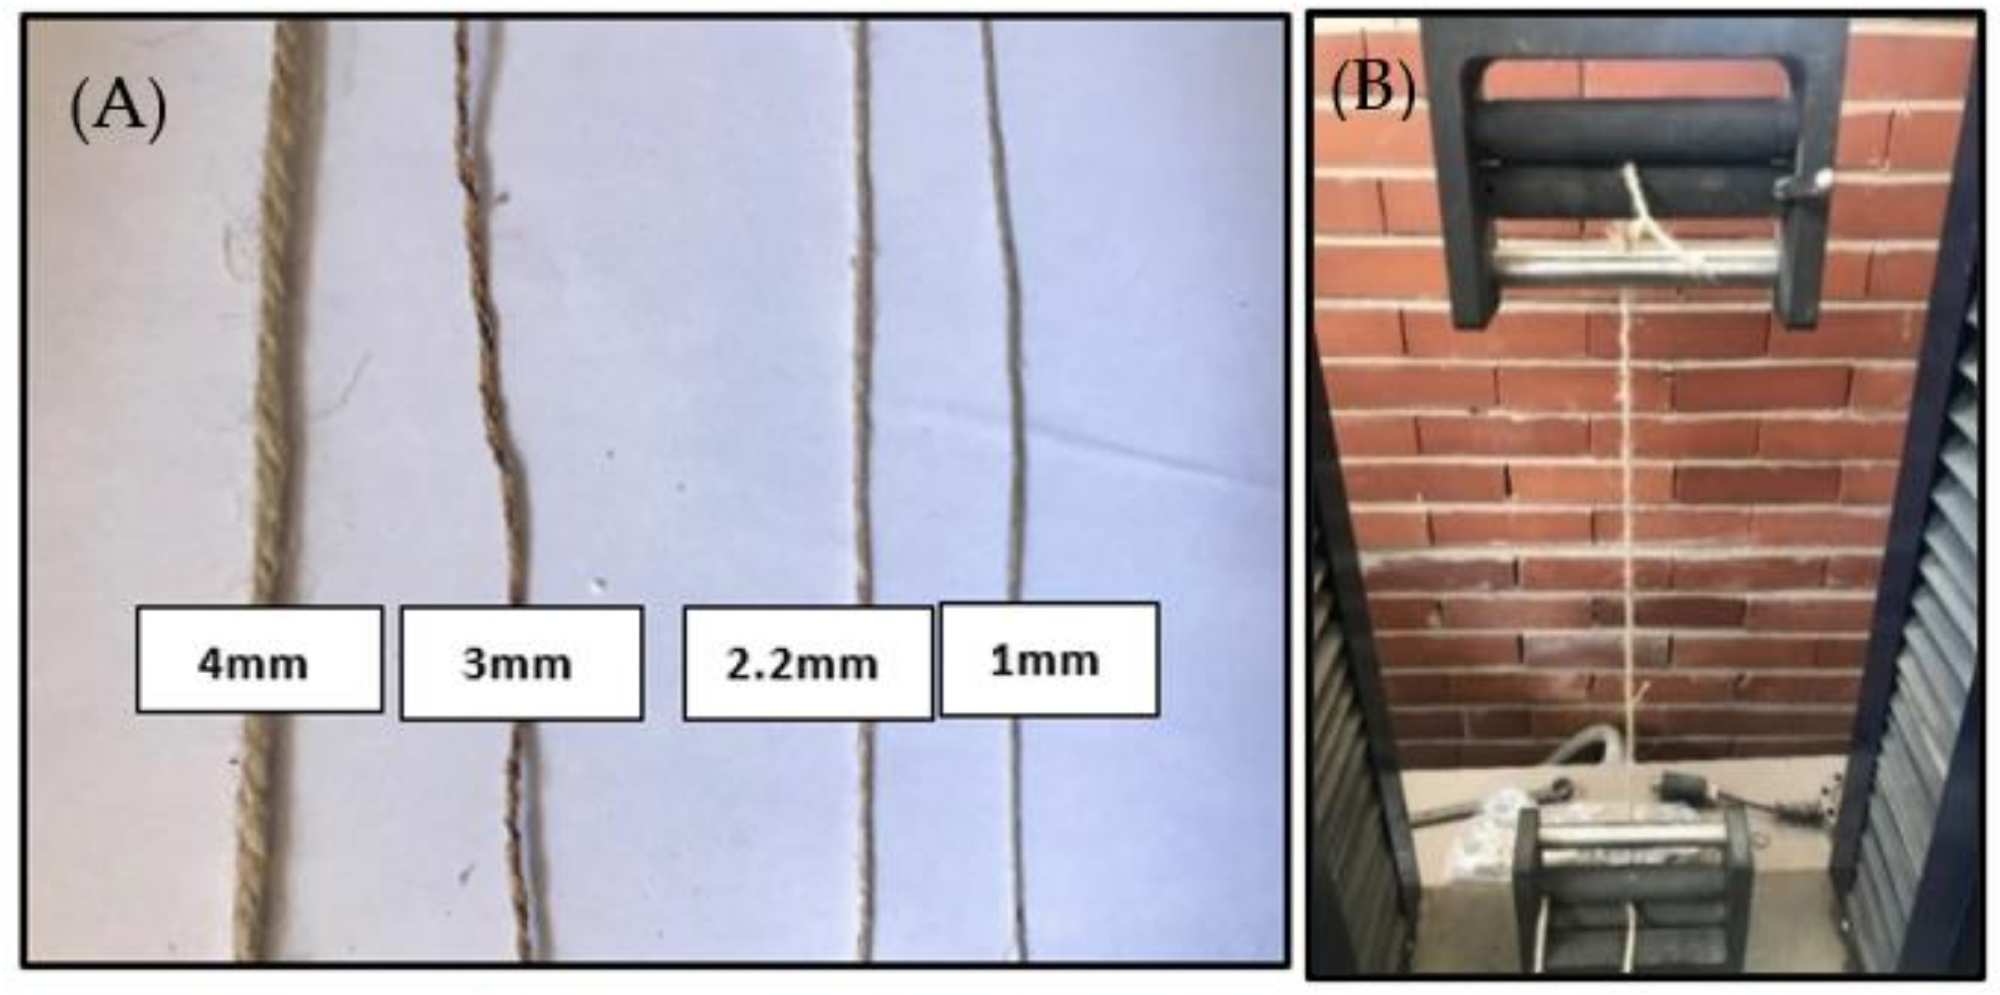
Figure 22. Braids of different diameter subjected to tensile test (A) and machine used for tensile tests on the hemp braids (B). Image Credit: Dovino, et al., 2022
Conclusion
Since the construction sector has such a large impact on the environment, modern scientific research is focusing on developing sustainable and renewable resources to reduce polluting and nonrecyclable materials. In this context, the goal of this study was to create a lime mortar that is premixed and reinforced with hemp fibers to produce a high-quality biocomposite with appropriate mechanical qualities.
The flexural strength of the mortars obtained with the inclusion of hemp braids improved only for a few specimens as compared to the control specimens. It was discovered that as the percentage of braids rose, the trend reduced. On the other hand, the average of the ultimate deformations improved by 74%, indicating that the fiber-reinforced specimens are more ductile.
Journal Reference:
Davino, A., Meglio, E., Formisano, A. (2022) Lime-Based Plaster Reinforced with Hemp Braids as Sustainable Building Product. Architecture, 2(1), p. 8. Available Online: https://www.mdpi.com/2673-8945/2/1/8/htm
References and Further Reading
- Keeler, M & Burke, B (2009) Fundamentals of Integrated Design for Sustainable Building; John Wiley & Sons, Inc.: Hoboken, NJ, USA.
- Sanal, I & Verma, D (2019) Construction Materials Reinforced with Natural Products; EPA: Washington, DC, USA; pp. 2119–2142.
- Pickering, K. L., et al. (2016) A review of recent developments in natural fiber composites and their mechanical performance. Composites Part A: Applied Science and Manufacturing, 83, pp. 98–112. doi.org/10.1016/j.compositesa.2015.08.038.
- Li, M., et al. (2020) Recent advancements of plant-based natural fiber–reinforced composites and their applications. Composites Part B: Engineering, 200, p.108254. doi.org/10.1016/j.compositesb.2020.108254.
- Zakaria, M., et al. (2016) Scope of using jute fiber for the reinforcement of concrete material. Textiles and Clothing Sustainability, 2, pp. 1–10. doi.org/10.1186/s40689-016-0022-5.
- Pickering, K.L., et al. (2007) Optimising industrial hemp fiber for composites. Composites Part A: Applied Science and Manufacturing, 38, pp. 461–468. doi.org/10.1016/j.compositesa.2006.02.020.
- Aruan Efendy, M G & Pickering, K L (2014) Comparison of harakeke with hemp fiber as a potential reinforcement in composites. Composites Part A: Applied Science and Manufacturing, 67, pp. 259–267. doi.org/10.1016/j.compositesa.2014.08.023.
- Menna, C., et al. (2015) structural behaviour of masonry panels strengthened with an innovative hemp fiber composite grid. Construction and Building Materials, 100, pp. 111–121. doi.org/10.1016/j.conbuildmat.2015.09.051.
- De Rosa, I.M., et al. (2010) Tensile behavior of new zealand flax (phormium tenax) fibers. Journal of Reinforced Plastics and Composites, 29, pp. 3450–3454. doi.org/10.1177/0731684410372264.
- Cao, Y & Wu, Y (2008) Evaluation of statistical strength of bamboo fiber and mechanical properties of fiber reinforced green composites. Journal of Central South University of Technology, 15, pp. 564–567. doi.org/10.1007/s11771-008-0422-z.
- Mustafa, A.E., et al. (2015) Selection and verification of kenaf fibers as an alternative friction material using weighted decision matrix method. Materials & Design, 67, pp. 577–582. https://doi.org/10.1016/j.matdes.2014.10.091.
- Goda, K., et al. (2006) Improvement of plant based natural fibers for toughening green composites—Effect of load application during mercerization of ramie fibers. Composites Part A: Applied Science and Manufacturing, 37, pp. 2213–2220. doi.org/10.1016/j.compositesa.2005.12.014.
- Prasad, B M & Sain, M M (2016) Mechanical properties of thermally treated hemp fibers in inert atmosphere for potential composite reinforcement. Materials Research Innovations, 7, pp. 231–238. doi.org/10.1007/s10019-003-0258-y.
- Fan, M (2010) Characterization and performance of elementary hemp fibers: Factors influencing tensile strength. BioResources, 5, pp. 2307–2322.
- Jones, D & Brischke, C (2015) Performance of Bio-Based Building Materials; Woodhead Publishing: Cambridge, UK.
- Walker, R., et al. (2014) Mechanical properties and durability of hemp-lime concretes. Construction and Building Materials, 61, pp. 340–348. doi.org/10.1016/j.conbuildmat.2014.02.065.
- Asprone, D., et al. (2011) Potential of structural pozzolanic matrix–hemp fiber grid composites. Construction and Building Materials, 25, pp. 2867–2874. doi.org/10.1016/j.conbuildmat.2010.12.046.
- Awwad, E., et al. (2012) Studies on fiber-reinforced concrete using industrial hemp fibers. Construction and Building Materials, 35, pp. 710–717. doi.org/10.1016/j.conbuildmat.2012.04.119.
- Le, A.T., et al. (2014) Experimental investigation on the mechanical performance of starch–hemp composite materials. Construction and Building Materials, 61, pp. 106–113. doi.org/10.1016/j.conbuildmat.2014.01.084.
- Jami, T., et al. (2019) A review of the properties of hemp concrete for green building applications. Journal of Cleaner Production, 239, p. 117852. doi.org/10.1016/j.jclepro.2019.117852.
- Piot, A., et al. (2017) Study of a hempcrete wall exposed to outdoor climate: Effects of the coating. Construction and Building Materials, 139, 540–550. doi.org/10.1016/j.conbuildmat.2016.12.143.
- Wei, J & Meyer, C (2014) Degradation rate of natural fiber in cement composites exposed to various accelerated aging environment conditions. Corrosion Science, 88, pp. 118–132. doi.org/10.1016/j.corsci.2014.07.029.
- Lee, B.-H., et al. (2009) Fabrication of long and discontinuous natural fiber reinforced polypropylene biocomposites and their mechanical properties. Fibers and Polymers, 10, pp. 83–90. doi.org/10.1007/s12221-009-0083-z.
- Silva, F. d. A., et al. (2009) Cracking mechanisms in durable sisal fiber reinforced cement composites. Cement and Concrete Composites, 31, pp. 721–730. doi.org/10.1016/j.cemconcomp.2009.07.004.
- Savastano, H., et al. (2009) Fracture and fatigue of natural fiber-reinforced cementitious composites. Cement and Concrete Composites, 31, pp. 232–243. doi.org/10.1016/j.cemconcomp.2009.02.006.
- Li, X., et al. (2007) Chemical treatments of natural fiber for use in natural fiber-reinforced composites: A review. Journal of Polymers and the Environment, 15, pp. 25–33. doi.org/10.1007/s10924-006-0042-3.
- Facca, A.G., et al. (2006) Predicting the elastic modulus of natural fiber reinforced thermoplastics. Composites Part A: Applied Science and Manufacturing, 37, pp. 1660–1671. doi.org/10.1016/j.compositesa.2005.10.006.
- Thomason, J L (2016) Why are Natural Fibers Failing to Deliver on Composite Performance? University of Strathclyde: Glasgow, UK.
- Formisano, A & Davino, A (2020) Tensile testing on hemp stems. In International Conference of Numerical Analysis and Applied Mathematics; ICNAAM: Girne, Turkey.
- Walker, R (2013) A Study of the Properties of Lime-Hemp Concrete with Pozzolans; Trinity College: Dublin, Ireland.
- Eurocodes (2015) UNI EN 459-1 Building Lime. Part 1: Definitions, s.a.c.c; European Commission: Bruxelles, Belgium.
- Eurocodes (2016) UNI EN 998-1 Specification for Mortar for Masonry. Part 1: Rendering and Plastering Mortar; European Commission: Bruxelles, Belgium.
- UNI 7044 (1972) Determination of the Consistency of Cement Mortars Using a Shaking Table; Italian National Unification Body (UNI): Rome, Italy.
- Eurocodes (2016) UNI EN 196-1Test Methods for Concretes. Part 1: Determination of Compressive Strength; European Commission: Bruxelles, Belgium.
- Eurocodes (2010) UNI EN 771-1 Specification for Masonry Units. Part 1: Clay Masonry Units; European Commission: Bruxelles, Belgium.
- Eurocodes (2010) UNI EN 772-1 Methods of test for Masonry Units. Part 1: Determination of Compressive Strength; European Commission: Bruxelles, Belgium